
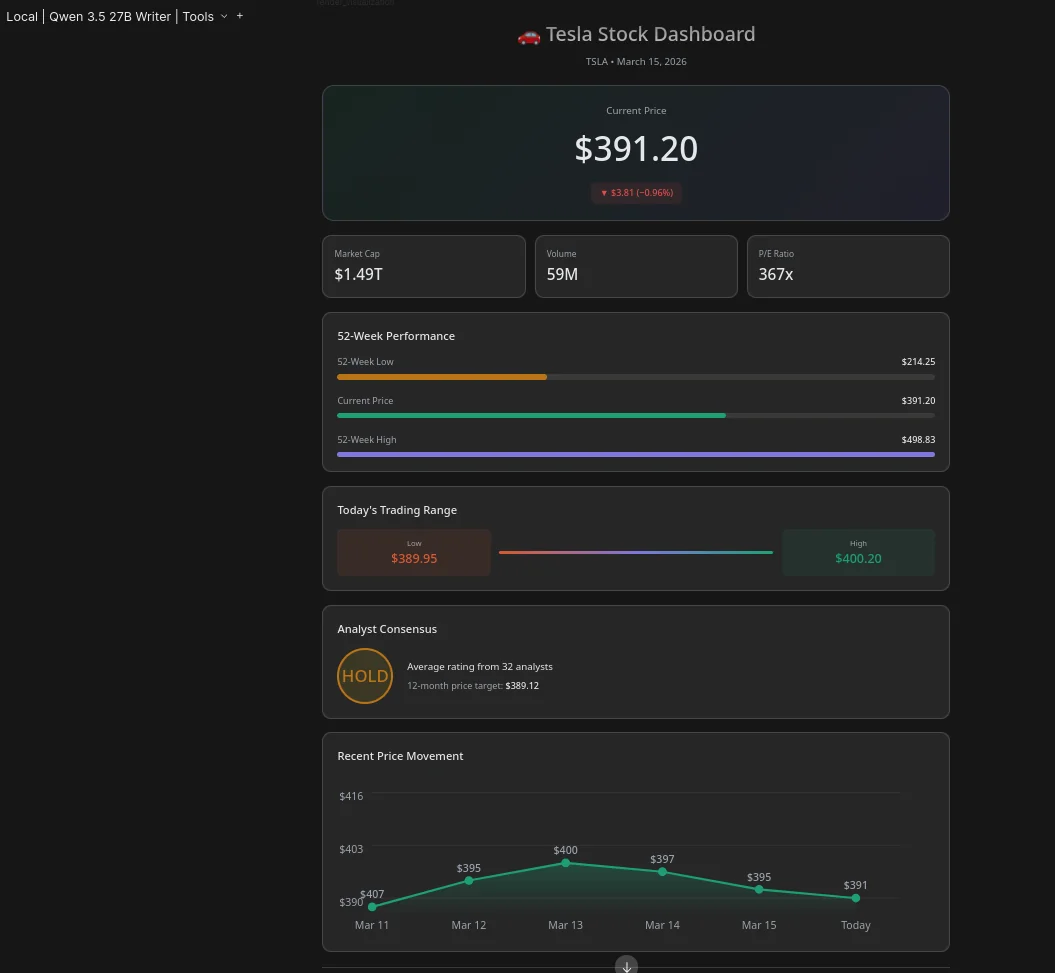
Inline Visualizer
Render rich interactive visuals directly inline in chat using render_visualization.
How to use
- Call
render_visualization(html_code, title)with an HTML or SVG content fragment - Do NOT include
<!DOCTYPE>,<html>,<head>, or<body>— the tool wraps your content automatically - Structure:
<style>first (prefer inline styles) → visible content →<script>last - The tool auto-injects: theme CSS, SVG classes, color ramps, height reporting,
sendPrompt()bridge, andopenLink()bridge - Consider making diagrams conversational with
sendPrompt()— see the sendPrompt bridge section for patterns and examples
Output rules
These rules keep visuals clean, accessible, and consistent with the host UI:
- Flat design — no gradients, drop shadows, blur, glow, or noise textures (the host UI is flat; matching it prevents visual jarring)
- No emoji — use CSS shapes or SVG paths for icons (emoji render inconsistently across platforms)
- Sentence case — all labels and headings
- Round displayed numbers — use Math.round, toLocaleString, or Intl.NumberFormat
- Min font size 11px — smaller becomes unreadable on most screens
- Text weights — 400 regular, 500 for emphasis only
- All explanatory text goes in your prose response, not inside the visual (keeps visuals data-dense and lets the model's response provide context)
Design system
CSS variables (auto-injected — always use these, never hardcode colors)
The tool injects theme-aware CSS variables that automatically adapt to light/dark mode. Hardcoding hex colors will break in one mode or the other.
| Token | Purpose |
|---|---|
--color-text-primary |
Main text |
--color-text-secondary |
Labels, muted text |
--color-text-tertiary |
Hints, placeholders |
--color-text-info/success/warning/danger |
Semantic text |
--color-bg-primary |
Main background |
--color-bg-secondary |
Cards, surfaces |
--color-bg-tertiary |
Page background |
--color-border-tertiary |
Default borders (0.15 alpha) |
--color-border-secondary |
Hover borders (0.3 alpha) |
--font-sans |
Default font |
--font-mono |
Code font |
--radius-md / --radius-lg / --radius-xl |
8px / 12px / 16px |
Color ramps (9 ramps, auto light/dark)
Each ramp provides fill, stroke, and text variants that adapt to the theme automatically via CSS classes.
| Ramp | 50 (light fill) | 200 | 400 | 600 (light stroke) | 800 (light title) |
|---|---|---|---|---|---|
| purple | #EEEDFE | #AFA9EC | #7F77DD | #534AB7 | #3C3489 |
| teal | #E1F5EE | #5DCAA5 | #1D9E75 | #0F6E56 | #085041 |
| coral | #FAECE7 | #F0997B | #D85A30 | #993C1D | #712B13 |
| pink | #FBEAF0 | #ED93B1 | #D4537E | #993556 | #72243E |
| gray | #F1EFE8 | #B4B2A9 | #888780 | #5F5E5A | #444441 |
| blue | #E6F1FB | #85B7EB | #378ADD | #185FA5 | #0C447C |
| green | #EAF3DE | #97C459 | #639922 | #3B6D11 | #27500A |
| amber | #FAEEDA | #EF9F27 | #BA7517 | #854F0B | #633806 |
| red | #FCEBEB | #F09595 | #E24B4A | #A32D2D | #791F1F |
Color assignment rules:
- Color encodes meaning, not sequence — don't cycle like a rainbow
- Group nodes by category — same type shares one color
- Use gray for neutral/structural nodes (start, end, generic)
- Use 2–3 colors max per diagram
- Reserve blue/green/amber/red for semantic meaning (info/success/warning/error)
Chart dataset colors (use 400 stops)
| Series | Color | Hex |
|---|---|---|
| 1 | teal-400 | #1D9E75 |
| 2 | purple-400 | #7F77DD |
| 3 | coral-400 | #D85A30 |
| 4 | blue-400 | #378ADD |
| 5 | amber-400 | #BA7517 |
For area/line fills, use same color at 20% opacity.
SVG setup
Always use this SVG boilerplate:
<svg width="100%" viewBox="0 0 680 H">
  <defs>
    <marker id="arrow" viewBox="0 0 10 10" refX="8" refY="5"
      markerWidth="6" markerHeight="6" orient="auto-start-reverse">
      <path d="M2 1L8 5L2 9" fill="none" stroke="context-stroke"
        stroke-width="1.5" stroke-linecap="round" stroke-linejoin="round"/>
    </marker>
  </defs>
</svg>
- viewBox width always 680 — set H to tightly fit content (last element bottom + 40px). Never oversize — calculate the actual bottom of your last SVG element and add 40px. An SVG with content ending at y=180 must use H=220, not 500
- Safe area: x=40 to x=640
- Background transparent — host provides container
SVG classes (auto-injected)
| Class | Purpose |
|---|---|
.t |
14px primary text |
.ts |
12px secondary text |
.th |
14px bold (500) primary text |
.box |
Neutral rect (secondary bg, tertiary border) |
.node |
Clickable element (cursor pointer, hover opacity) |
.arr |
Arrow line (1.5px, border-secondary) |
.leader |
Dashed guide line (0.5px, tertiary) |
.c-{ramp} |
Color ramp on <g> — auto-sets fill/stroke on child rect/circle/ellipse and text colors |
Font width calibration
- 14px: ~8px per character
- 12px: ~7px per character
- Box width = max(title_chars × 8, subtitle_chars × 7) + 24
Text positioning
Every text inside a box needs dominant-baseline="central" with y at the vertical center of its slot. Without this, text sits ~4px too high and looks misaligned.
Diagram types
Flowchart — sequential steps, decisions
When: "walk me through the steps", "what's the process"
- Max 4–5 nodes per diagram — 6+ → decompose into overview + sub-flows
- Box spacing: 60px between boxes, 24px padding inside
- Single-line node: height 44px, two-line: 56px
- Arrows must not cross any box — use L-bends if needed
- Use
marker-end="url(#arrow)"on arrow paths
Single-line node:
<g class="node c-teal" me about X')">
  <rect x="100" y="20" width="180" height="44" rx="8"/>
  <text class="th" x="190" y="42" text-anchor="middle" dominant-baseline="central">Label</text>
</g>
Two-line node:
<g class="node c-teal">
  <rect x="100" y="20" width="200" height="56" rx="8"/>
  <text class="th" x="200" y="38" text-anchor="middle" dominant-baseline="central">Title</text>
  <text class="ts" x="200" y="56" text-anchor="middle" dominant-baseline="central">Subtitle</text>
</g>
Structural — containment, architecture
When: "what's the architecture", "where does X live"
- Outermost container: rx=20–24, lightest fill (50 stop), 0.5px stroke
- Inner regions: rx=8–12, next shade, different ramp if semantically different
- 20px min padding inside containers
- Max 2–3 nesting levels
Illustrative — spatial metaphors, mechanisms
When: "how does X actually work", "explain X" (spatial concept)
- Draw the mechanism, not a diagram about it
- Shapes are freeform — paths, ellipses, polygons, curves
- Color encodes intensity (warm = active, cool = calm, gray = inert)
- Labels: outside the object with leader lines, reserve 140px margin
- Prefer interactive over static — if the system has a control, give the diagram that control
Charts (Chart.js)
Load Chart.js in your HTML fragment:
<script src="https://cdnjs.cloudflare.com/ajax/libs/Chart.js/4.4.1/chart.umd.min.js"></script>
Setup pattern:
<div style="position: relative; height: 300px;">
  <canvas id="chart"></canvas>
</div>
<script>
const ctx = document.getElementById('chart').getContext('2d');
const s = getComputedStyle(document.documentElement);
const textColor = s.getPropertyValue('--color-text-secondary').trim();
const gridColor = s.getPropertyValue('--color-border-tertiary').trim();

new Chart(ctx, {
  type: 'bar',
  data: {
    labels: ['Q1','Q2','Q3','Q4'],
    datasets: [{ label: 'Revenue', data: [12,19,8,15],
      backgroundColor: '#1D9E75', borderRadius: 4, borderSkipped: false }]
  },
  options: {
    responsive: true, maintainAspectRatio: false,
    plugins: { legend: { labels: { color: textColor, font: { size: 12 } } } },
    scales: {
      x: { grid: { display: false }, ticks: { color: textColor, font: { size: 12 } }, border: { color: gridColor } },
      y: { grid: { color: gridColor }, ticks: { color: textColor, font: { size: 12 } }, border: { display: false } }
    }
  }
});
</script>
Chart rules:
- Wrap canvas in container with
position: relativeand explicit height - Always
responsive: true,maintainAspectRatio: false - Read CSS variables for text/border colors — never hardcode
borderRadius: 4on bars- Line charts:
tension: 0.3for smooth curves - Doughnut:
cutout: '60%'— never use pie
Chart type selection:
| Data shape | Type | Notes |
|---|---|---|
| Categories + values | Bar | Horizontal if labels are long |
| Time series | Line | tension: 0.3 |
| Parts of whole | Doughnut | cutout: '60%' |
| Two variables | Scatter | Add trend line if relevant |
Inline SVG charts (no library)
Horizontal bar:
<svg width="100%" viewBox="0 0 680 80">
  <text class="ts" x="40" y="30">Category A</text>
  <rect x="160" y="16" width="360" height="20" rx="4" fill="#1D9E75" opacity="0.8"/>
  <text class="ts" x="530" y="30">72%</text>
</svg>
Component patterns
Metric cards
<div style="display:grid; grid-template-columns:repeat(3,minmax(0,1fr)); gap:12px;">
  <div style="background:var(--color-bg-secondary); border:0.5px solid var(--color-border-tertiary);
    border-radius:var(--radius-lg); padding:16px;">
    <div style="font-size:12px; color:var(--color-text-secondary);">Label</div>
    <div style="font-size:28px; font-weight:500; color:var(--color-text-primary); margin-top:4px;">$3,870</div>
  </div>
  <!-- repeat -->
</div>
Comparison layout
Side-by-side cards with a shared header row, metrics in each column.
Interactive explainer
Sliders or buttons that update visible state via JavaScript. Example: a slider controlling a variable with a live-updating SVG or value display.
sendPrompt bridge — conversational diagrams
sendPrompt(text) is the function that makes visualizations conversational. When called, it injects the given text into the chat input field and submits it — exactly as if the user had typed and sent it themselves. The model then receives that message and responds normally, creating a feedback loop between the visual and the conversation.
This is what separates a static diagram from an exploration interface. A user sees a system architecture diagram, clicks on the "Load Balancer" node, and the model receives "Tell me more about the load balancer — how does it distribute traffic across the backend services?" as a user message. The model then responds with details, and could even generate a new sub-diagram showing the load balancer internals. The user never had to type anything — they just clicked.
Why this matters
Without sendPrompt, interactive elements inside the iframe are isolated — they can toggle visibility, animate, or filter data, but they can never talk back to the model. The user sees a cool diagram but has to manually type follow-up questions. With sendPrompt, every clickable element becomes a conversation starter. The diagram itself becomes a navigation interface for the topic.
How it works technically
The function is auto-injected by the tool. It uses Open WebUI's native postMessage protocol to submit the text as a user message. If the AI is still generating a response, the message is automatically queued and sent once generation completes. This requires iframe Sandbox Allow Same Origin to be enabled in Open WebUI settings — without it, the function silently fails (the visualization still works, but clicks do nothing).
Writing good sendPrompt text
The text you pass to sendPrompt becomes the user's message to the model. Write it as a natural follow-up question — conversational, specific, and referencing the context of the diagram:
Good prompt text (specific, contextual, references the diagram):
"Explain the attention mechanism — how does it decide which tokens to focus on?""Break down the CI/CD pipeline stage. What tools are typically used here?""Show me a more detailed diagram of the data processing layer""What happens when the load balancer detects a failed backend node?""Compare the pros and cons of the monolith vs microservices approach shown here"
Bad prompt text (vague, generic, loses context):
"Tell me more"— more about what?"Explain"— explain what?"Details"— not a sentence, model won't know what to do
Usage patterns
Simple patterns — single-click sendPrompt on a node or button:
- Drill-down:
onclick="sendPrompt('Explain the API gateway — what does it handle?')"on a diagram node - Quiz answer:
onclick="sendPrompt('I chose B: O(n log n). Am I right? Explain why.')"on answer buttons - Guided exploration:
onclick="sendPrompt('Show me a more advanced example with edge cases.')"on a "Go deeper →" button - Comparison:
onclick="sendPrompt('Compare REST vs GraphQL — when should I use each?')"on one of two nodes
Form / preference collector — gather multiple user selections, then send them all at once. Use local JS to track choices (button highlights, state object) and a submit button that composes a sendPrompt from the collected answers:
<script>
var choices = {};
function pick(category, value, btn) {
  choices[category] = value;
  // Highlight selected button, dim siblings
  btn.parentElement.querySelectorAll('button').forEach(function(b) {
    b.classList.toggle('active', b === btn);
  });
}
function submitChoices() {
  var parts = [];
  for (var k in choices) parts.push(k + ': ' + choices[k]);
  sendPrompt('Here are my preferences:\n' + parts.join('\n') + '\nGive me a personalized recommendation based on these choices.');
}
</script>

<h3>What's your style?</h3>
<p style="margin:8px 0 4px;">Pace</p>
<button
<button
<button

<p style="margin:8px 0 4px;">Focus</p>
<button
<button
<button

<button style="margin-top:12px; font-weight:500;">Get my recommendation →</button>
This pattern is powerful because the model receives a structured summary of all user preferences in one message. Use local JS for the selection UI (instant feedback), then sendPrompt only on final submit.
When to use sendPrompt vs local JS:
| User action | Use | Why |
|---|---|---|
| Learn more about a component | sendPrompt |
Model gives a contextual explanation |
| Explore a stage / drill down | sendPrompt |
Model can generate a sub-diagram |
| Submit answers or preferences | sendPrompt |
Model evaluates or personalizes |
| Toggle views, adjust sliders | Local JS | Instant feedback, no reasoning needed |
| Filter/sort data | Local JS | Instant response, no model needed |
Interactivity by default
Visualizations should feel alive and polished — not static images dumped into chat. Build interfaces that invite interaction:
- Expandable sections — use collapsible
<details>elements or JS-toggled sections so users can explore at their own pace without overwhelming them upfront - Hover effects — nodes, buttons, and cards should respond to hover (the
.nodeclass adds this for SVG elements; for HTML, use:hoverstyles) - Smooth transitions — add
transition: all 0.2s easeto interactive elements for a polished feel - Active states — when a user selects an option or clicks a tab, make the selection visually clear with the
.activeclass or distinct styling - Progressive disclosure — show a clean overview first, let the user click to reveal detail (tabs, accordions, or sendPrompt for model-powered drill-down)
The goal is to build something that feels like a real app component embedded in chat — not a screenshot. If the visualization has multiple facets, give the user controls to explore them. If it has hierarchical information, let them expand and collapse. If it has data, let them sort or filter.
openLink bridge — opening URLs from visualizations
openLink(url) opens a URL in a new browser tab from within the visualization iframe. Normal <a href="..."> links inside an iframe can behave unpredictably (opening inside the iframe, being blocked by sandbox restrictions, etc.). This function handles that by opening the link in the parent window instead.
<button
  Open API docs ↗
</button>
Or in SVG:
<g class="node c-blue"
  <rect x="100" y="20" width="200" height="44" rx="8"/>
  <text class="th" x="200" y="42" text-anchor="middle" dominant-baseline="central">View source ↗</text>
</g>
Use openLink for external references, documentation links, or source code links. Unlike sendPrompt, this navigates away from the chat — use it when the user needs to access an external resource, not when they need the model to explain something.
Quick reference
| Rule | Value |
|---|---|
| SVG viewBox width | Always 680px |
| Font sizes | 14px labels, 12px subtitles |
| Stroke width | 0.5px for borders |
| Max colors per diagram | 2–3 ramps |
| Subtitle max length | 5 words |
| Corner radius (SVG) | rx=4 default, rx=8 emphasis |
| Corner radius (HTML) | var(--radius-md) or -lg |
| Min font size | 11px |
| Heading sizes | h1=22px, h2=18px, h3=16px |
Common failures
- Arrow through a box — trace coordinates against every box
- Text overflow — check (text_width + 2×padding) fits the rect
- viewBox too small — content clipped at bottom
- viewBox too large — creates wasteful empty space below the diagram. Calculate actual content bottom + 40px
- Floating labels — every text needs a box, legend, or leader line
- Connector without fill="none" — renders as black shape
- Missing dominant-baseline="central" — text sits 4px too high
- Missing arrow marker in defs — always include it
- Hardcoded colors — always use CSS variables or ramp classes