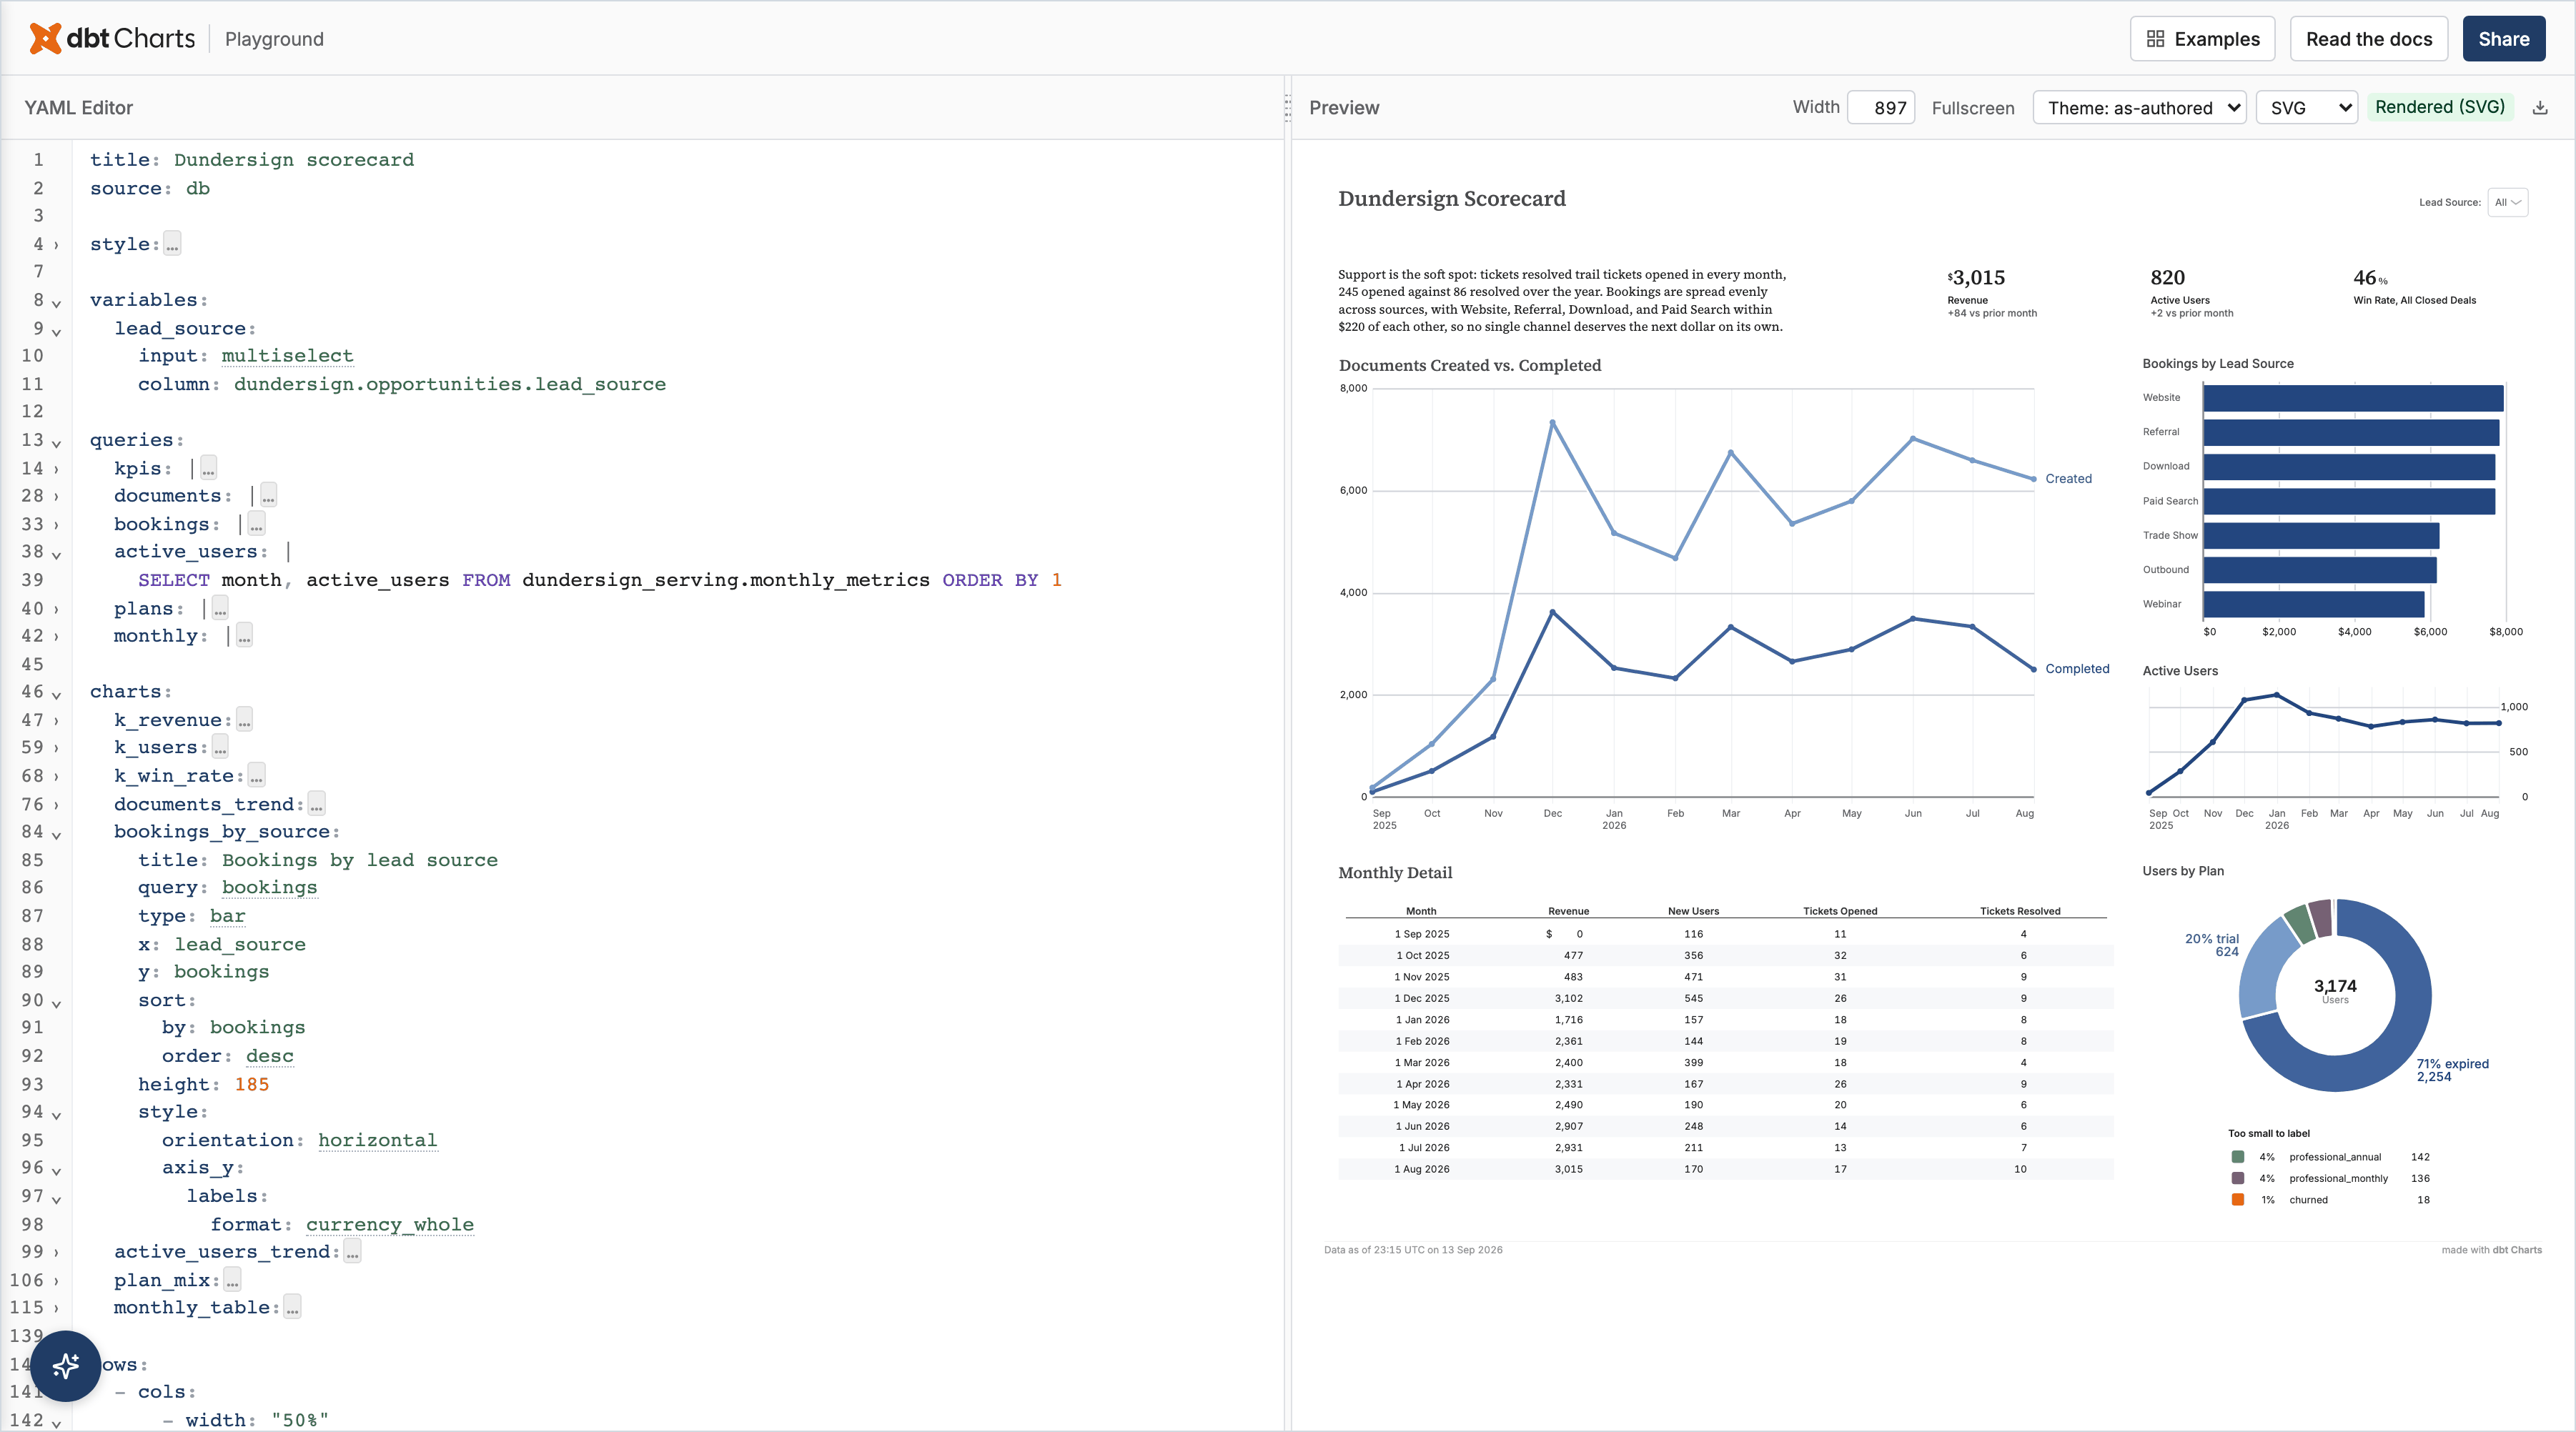
Board migrate
The user wants an existing dashboard (a Looker, Sigma, Hex or Omni page, an
export, a screenshot) as a dbt Charts board. This is a migration, not a
redesign. Set your design opinions aside for the whole job: the
one-screen/≤8-visualization guidance in {{ s_skill_chart }} does not apply,
chart-choice preferences do not apply, "this would be cleaner as…" does not
apply. The source is the spec. A 40-tile source means a 40-tile board.
Work from the source's own files, never from memory of what the dashboard
"probably" shows. Write only the target board: never delete, move or
overwrite project files, the bundle, or anything you did not create.
Getting a bundle
A source bundle is a directory with one layout for every tool.
{{#if_surface cli}}For supported tools, fetch one (credentials come from
environment variables; --help names them):
dct import looker <dashboard URL or id>   # LOOKER_CLIENT_ID / _SECRET
dct import sigma <workbook URL or id>     # SIGMA_CLIENT_ID / _SECRET; --list <text> to find one
dct import hex <project URL or id>        # HEX_API_TOKEN; --list
dct import omni <dashboard URL or id>     # OMNI_API_KEY; --list
Each writes ./<tool>-<id>/ (--out to change it) and prints the path.
API keys
dct import reads keys from the environment only. When one is missing,
follow the project's own instructions for keys if it has them (an AGENTS.md,
a skill, a .env.example). Otherwise ask once: a gitignored .env at the
project root (offer this), or their own way (shell profile, a secrets
manager), which you then follow. For a .env:
- Confirm
git check-ignore .env prints .env; if not, add .env to
.gitignore first.
- Append the variable names the tool needs, values empty
(
LOOKER_CLIENT_ID=), without touching lines already there.
- Open it for them (
code .env, or their editor) and tell them where the
tool's keys come from: Looker → Account → API keys (an admin may need to
enable them); Sigma → Administration → Developer Access (a Sigma admin
creates them; also set SIGMA_API_BASE for the org's region); Hex and
Omni → the workspace's API token settings. With a bare id rather than a
URL, also set <TOOL>_BASE_URL. Values go in single quotes
(LOOKER_CLIENT_SECRET='…') so the shell keeps $ and spaces.
- Once they say it is saved, load it in the same command as the import:
set -a; . ./.env; set +a; dct import looker <URL>.
Never read, print or cat .env or a key.
{{/if_surface}}If the user already has a bundle, use it. For any other tool,
either write a small fetcher against its API that emits the layout below, or
work from screenshots (§ Sources → Screenshots). Never write a credential
value into a file, commit or chat yourself.
Bundle layout
| Path |
Use it for |
outline.md |
Read first. Pages → tiles in reading order: kind, title, grid position, encodings, formats, filters, controls and which tiles each control reaches. A digest, not the truth |
raw definition (dashboard.json, contents.json, project.hex.yaml) |
Authoritative. Grep it whenever the outline is silent or ambiguous: control modes, label formats, totals, axis ranges, hidden flags, text-tile templates |
queries/ |
The source's compiled SQL per tile. Source tables, business rules, and the workbook-wide filters the outline never shows |
png/ |
The source's own render of each page (Hex: each chart cell). The visual target; look at every one before writing YAML |
kpi/ |
Current value of each single-number tile. Your parity numbers |
source.json |
Tool, URL, fetch time, and extras such as query_timezones |
A screenshot-only bundle has png/ and source.json, nothing else.
A tile or image the import could not fetch is named in outline.md with the source's error.
Modes — ask once, before any YAML
Ask one question up front, unless the caller already set it: keep the
source's SQL verbatim, or rewrite it clean? Never pick silently.
- Verbatim. Each tile keeps the source's compiled query, changed only where
variables and the project's table qualifiers require. Faithful first step;
every cleanup is then an offered pass.
- Clean. Rethink each query from what its chart needs and write it fresh
over the project's models, applying the clean-mode rules in § Rules. The
source's SQL is evidence of what each number means, never a template.
Nothing that changes a value.
Parity (§ Prove it) is the acceptance test in both modes. On a large board
(below) the structure checkpoint is the only other question; the cleanup offers
come after parity. Three questions at most.
Two phases, one job — do not hand back at the seam
Work in two phases: the look on placeholder data first, real data second.
The phase-1 board doubles as your notes: every value you read off the source is
recorded as inline data, ready to check phase-2 queries against. With a bundle
that has queries/ and kpi/, phase 1 is quick; do not skip it.
The phases are your working order, not a delivery boundary. Run straight
through both and deliver a board on live data. Nothing runs between turns:
stopping after phase 1 without a question ends the job with invented numbers.
- Roughly ten or fewer tiles that need a query — no check-in.
- More than that — say up front you'll build the structure on placeholder
data and come back before wiring queries. Deliver phase 1, ask whether the
structure is right, and wire the queries as soon as they say go.
A phase-1 board is never "migrated": call it "phase 1 of 2 — structure only,
every number is a placeholder", and end it with a next step or a question.
The fidelity contract
Data faithful, visually default.
Copy from the source (the data and what it means):
- Pages, sections, tile order, and every tile's chart type, orientation and
stacking (stacked, grouped, 100%) exactly as the raw definition states:
a stacked bar stays stacked. dbt Charts groups a colored bar by default, so a
stacked source needs
style: stack: zero (100%: stack: normalize)
- Metric and dimension names: the words that carry meaning in titles, series,
columns and controls. Strip decoration: emoji, a leading
#, Sum of …/Count of … generator prefixes, and typos (fix the spelling)
- Every control, its label, default and the tiles it reaches
- Data semantics: metrics, dimensions, grain, filters, sort, date window, totals
- Text tiles: every line, field and link
Keep dbt Charts' defaults (do not match the source's look): colors, fonts,
spacing, gridlines, title casing, tick formats and rotation, legend position,
data labels, column widths, axis titles, and number formats (compact by
default). Override a default only for a reason the reader would miss without
it, and say why in the chart's notes:. "The source does it" is not a reason.
- Color: only for a fixed meaning that is in the board (a target, a threshold,
good/bad), with theme tokens, never hex.
- Data labels: only when there are five or fewer marks, or one value is the point;
never on every point of a series.
- Dual axes: never by default. Two measures on different scales (a count and
hours, thousands and tens) become two charts side by side on the same query;
a reader compares their shapes, not their values. Several noisy series on two
scales become an index chart (each series over its own period-average
baseline, one axis) or small multiples.
- Precision: keep a source format only when its precision means something
(a rate to one decimal); otherwise use the built-in name for the kind
(
currency_compact, integer, percent). A KPI tile is the exception:
its number is the content, so it keeps the source's digits (currency_whole,
integer) and is compact only when the source itself abbreviates.
- No invisible layers or helper columns to fake a feature (an axis floor, stack
totals). Note the gap instead.
- Never invent data. A table the warehouse will not read, a query that fails,
a value you can only see in the screenshot: the chart stays blocked with a
notes: naming what is missing. No typed-in values, no UNNEST([STRUCT(...)])
or generator rows, no "placeholder" or "fake data" banners. A board that
shows a number must have run the query that produced it.
warnings_ignore needs a reason in notes:. Fix copy-edit warnings by fixing
the text.- YAML in block style: every mapping key on its own line, never an inline
{ position: right }. Inline lists ([a, b]) are fine.
Phase 1 — structure on placeholder data
1. Plan and banner
Write the mapping in chat first: page → tab or section, tile → chart name and
type, control → variable, and what you drop and why. Then open a new board
whose first and last rows are warning callouts:
charts:
  fake_data_warning:
    type: callout
    title: "Fake data"
    message: >-
      This board mirrors the source dashboard's structure. Every number below
      is a placeholder read off the source; no live query is wired yet.
    style:
      tone: warning
rows:
  - fake_data_warning
  # Rebuild the source sections here.
  - fake_data_warning
Both callouts stay until phase 2 has wired every tile; then delete them.
2. Rebuild every tile with inline values
Section by section, give each tile an inline values: query holding what the
source shows (KPIs exactly from kpi/, lines and bars as a handful of points,
tables as headers plus a few rows) and a chart that matches the source tile:
queries:
  weekly_active_orgs:
    notes: "Phase-1 placeholder — values read off the source"
    columns: [week, active_orgs]
    values:
      - [2026-06-01, 210]
      - [2026-06-08, 240]
Options to copy deliberately, each checked against the raw definition, not
only the PNG: orientation; stacking; which column splits series; sort; date
grain and window; KPI comparison, target and tone; table columns and page size;
totals; the hover card (a source tile's tooltip columns become the chart's
tooltip: list on bar, line, area, scatter and pie, in the source's order, with
the source's format when it differs from the column's). Everything visual
beyond that starts from the dbt Charts default.
3. Iterate until it looks right
Render after every tile ({{ s_skill_chart }} owns the build-validate loop —
one tile at a time, never one-shot). Then render the whole board{{#if_surface cli}}
to PNG, every tab, and put each next to its png/ page. A render shows one
tab: give tabs: an id: and pass each tab's slug (its title, lowercased,
punctuation dropped, spaces and hyphens as _) as that variable, and fix every error on every tab:
{{ s_render_png_example }}{{/if_surface}}{{#if_surface tool}} with
{{ s_render_board }} and compare its chart list with the source's tiles{{/if_surface}}.
Build the board in this session. If you hand pieces to sub-agents, wait for
every one and assemble its work before you finish; a session that ends with
work pending leaves an unfinished board.
Close phase 1 with a tally: "8 sections, 41 tiles — 41 rebuilt." A tile you
cannot represent is flagged to the user now, never silently dropped.
Phase 2 — wire real data
4. Find the tables
With a bundle, queries/ names the source tables: read from the same model the
source reads, never rebuild its logic from upstream tables. Read any hidden or
data-prep element's SQL first; its WHERE holds the workbook-wide rules.
Without SQL, explore the warehouse with {{ s_execute_sql }} against
INFORMATION_SCHEMA.
5. Swap tile by tile
Replace each placeholder with its real query, in the chosen mode, validating and
re-rendering as you go. In clean mode each chart gets its own query, written
from its intent (see Clean-mode SQL); in verbatim mode it keeps its tile's
compiled query. Name every query for what it returns (arr_by_month),
never by a source tile or element ID. A tile with no plausible source keeps its
placeholder and is marked blocked; keep going.
Fix every validate and render error before delivering; never hide one with
--allow-chart-errors. Remove the banner only when every tile is live or
flagged.
Rules
Each rule is one a reviewed migration showed being broken.
Controls
- Keep every source control, including ones empty by default — the raw
definition is the list, not the PNG's filter line.
- Wire each control to exactly the tiles it reaches (
listens, targets, and
the children of a targeted parent); a tile no control reaches stays unfiltered.
- Scope a page-only control to its tab (nested-board
variables:); a
board-wide variable shows on every tab. A control that sits in the page above
a group of tiles becomes the variables: of an inline board holding those
tiles (the rows/cols entry with its own variables, queries and
charts), so it appears where the source puts it. Only a control the source
places at the top of every page goes in the board's top-level variables:.
- Name variables for what they set; options from the data,
static: only for
true enums; multiselects get default: []. Labels are the source's.
- The default window is the source's (30 days stays 30 days, not 28 or a
rolling 12 months): wrong windows move every number.
What the reader sees
- Titles and labels keep the source's meaning in the theme's casing, without
decoration. The SQL mode goes in
notes, not titles.
- Source text: a heading is its section's
title, a note or description is
notes: or a plain text tile, a README page is a text tile. The finished
board has no callout.
- Formats: the built-in name for the value's kind (
currency_compact,
integer, percent, id) on charts; a KPI headline keeps the source's
digits (currency_whole, integer). Keep the source's precision only when it
means something. The source's value_format_name/formatString tells you
the kind and the unit, not the exact print. Currency stays currency and a rate
stays a percent; a plain count or a date takes no format:. Never write the
source's pattern (,d, $#,##0.00, %m/%d/%Y).
- Axis ranges: the default, unless the source sets one (Looker
minValue/
maxValue, Sigma axis bounds) or a zoom is the point (an uptime chart near
100%); say so in notes:. Both bounds set: scale: continuous: domain: [min, max]; only a minimum above zero: scale: continuous: zero: false. A pinned
domain that clips filtered data is a bug.
- Totals only where the source shows them, and visible on page one when it does.
A table shows a total row only when its source says so: Looker, the tile's
query has
total: true (row_total: right adds a total column; the
vis_config show_totals toggle alone draws nothing); Sigma, the element
lists axisTotals or totals: (totalPosition: first puts it on top).
Otherwise the table has none. A total row comes from its query
(GROUP BY ROLLUP or GROUPING SETS) with a role column,
IF(GROUPING(<dim>) = 1, 'total', 'value') AS row_role,
and row_role: row_role on the table chart, so the table styles it as a total
row with no row number. Its label cell reads Total. Sigma's own total joins
are never copied, but every total the source shows is rebuilt with that
ROLLUP and row_role form (a pivot's totals: or axisTotals with
visibility: shown counts as shown); a board that drops a shown total is
incomplete, not a gap to note.
- Data bars (Looker
series_cell_visualizations, Sigma data bars): a table spark
bar prints no number, so where the source shows data bars, show the value as its own column and the bar in a
second column right after it (select the value twice, n and n AS n_bar;
the bar column's label empty).
- Text and header tiles keep every line, field and link; README prose keeps
its content, with typos fixed.
- Wide detail tables keep every row and visible column, readable: full width,
max_widths, no LIMIT the source lacks.
- Timestamps keep time of day; dates keep their year.
- KPI targets carry good/bad tone (
percent_delta with tone); visible KPI
descriptions are drawn text, never notes:.
Scope and evidence
- Skip hidden, graveyard, draft and "to deprecate" pages; list them as dropped.
- Trust the definition over README prose: a README can be false; keep it
verbatim and list the false sentences.
- The source can be wrong (fan-out, a mislabeled axis, a forward-looking moving
average). Flag it with both numbers; fix it only with the user's yes.
Clean-mode SQL (always on in clean mode; none changes a value)
BI tools generate SQL for a semantic layer: they join every table an explore
might need and then de-duplicate, compute one wide base for many tiles,
protect every aggregate against fan-out, and convert time zones and format
labels in every query. None of that belongs on a board. Per chart:
- Write down the chart's intent first (measure and its definition, grain,
dimensions, filters), from the compiled SQL and the source's field names.
- Query the narrowest existing model that has those columns, directly, at the
chart's grain. Never a shared pre-aggregated base or CTE spine feeding many
charts. One exception: when three or more charts need the same joins and
filters, write one row-level base (joins and shared filters, no
GROUP BY)
and have those charts aggregate FROM {{ queries.<base>.cache }}. Don't
repeat the same join block in every chart.
- One base query, read through the cache: a Sigma data model or Looker derived
table that feeds many tiles is written once as a named query, and each tile
reads
FROM {{ queries.base.cache }} with a plain GROUP BY or filter in
DuckDB SQL. {{ queries.base }} inlines the base into every tile, so each
tile re-scans the warehouse. A base that scans tens of GB or returns far more
rows than the tiles need is a model, not a board query: flag it to the user.
- Grouped tables (Sigma
groupings, shown as grouping: lines in the outline;
Looker has no equivalent) are drill-downs. Migrate the level the page shows:
collapsed groups are one GROUP BY at the group grain with the group's
calculations as aggregates; expanded groups are detail rows with the group
columns first. One plain query; never port the self-joins, rank,
__Ordering/sort_ helper columns or limit 1000 in Sigma's SQL.
{{ queries.x }} inlines as (…) AS x: refer to its columns as x.col and
never write a second alias after it (FROM {{ queries.x }} AS r fails to
parse).- Join only tables whose columns are selected or filtered; no join-then-undo.
Filter with a plain
WHERE, not an EXISTS subquery a join or column filter
can replace.
- No
COALESCE(SUM(x), 0) or IFNULL around an aggregate unless the chart must
print 0 for an empty group.
- Before dropping a
SUM(DISTINCT …)/COUNT(DISTINCT …) guard, run the grain
check on the joined rows (SELECT COUNT(*), COUNT(DISTINCT key)): equal →
plain SUM/COUNT; different → aggregate at the right grain, then join.
- Date windows live on the board clock, not in SQL: set the board's time zone
(and fiscal start month) once, and filter with
{{ filter_date_range('col', var_or_preset) }} (a timestamp column is passed
bare) or a daterange variable whose default: is a preset (last_13_months,
this_fiscal_quarter). No CURRENT_DATE('<zone>') arithmetic per query.
The source's default window is the variable's preset default:, fiscal
included ("this fiscal quarter" → this_fiscal_quarter); never frozen dates.
Fiscal windows are fiscal presets with the fiscal start month set once on the
board; never DATE_TRUNC(DATE_ADD(…, INTERVAL 11 MONTH), QUARTER) math in SQL.
- Dates are typed at the grain; no
FORMAT_DATE/TO_CHAR on an axis column.
- No display text built in SQL (
FORMAT('%.1fK', …), label columns, helper
columns for axis floors): the chart's format and axis settings do that.
- Select only the columns the chart encodes; no
SELECT * from a raw table.
- Variables: one per concept, named for what it sets, options from the data.
- Strip source commentary and generated aliases; name columns as a reader would.
- Pivots: return long format and let the table's
rows:/columns:/values:
pivot it; each pivot field its own columns: level, in the source's order.
Cleanup passes (verbatim mode only: clean mode already applies them).
Offered after parity holds, in this order, one at a time: "I can do X; here's
what it changes; go?"; applied only on a yes, re-run against parity, shown as a
diff; never applied unasked.
- Timezone. Read the source's query timezone (
source.json) and the
warehouse session timezone (probe the adapter). Drop wrapping that converts
nothing (same zone, or a DATE column); move the rest to the board's
regional.time_zone.
- Fan-out precautions. Before replacing a symmetric aggregate
(
SUM(DISTINCT … MD5/HASH …)) run the grain check on the joined set
(SELECT COUNT(*), COUNT(DISTINCT key)) and report it. No fan-out → plain
SUM/COUNT; fan-out → aggregate each side at its grain, then join.
- Pivot-then-aggregate. One aggregation at the chart's grain; window
functions replace table calculations.
- Re-source. Read from the narrowest table or model that has the columns.
Report cruft counts per pattern (timezone wraps, date strings, symmetric
aggregates, double aggregations, SELECT *, cross joins) before and after.
Prove it
Deliver two tables; every mismatch gets a cause.
| KPI |
Source (kpi/) |
Board |
Δ |
Cause if ≠ |
| Tile |
Rows / series |
Matches? |
Cause if not |
Run the board at the source's defaults. Usual causes: late-arriving data since
the fetch, a different default window, a hidden-page rule you missed, a source
bug. When the bundle has queries/, re-run the source's SQL now and compare
against that, not only the snapshot. Then deliver the tally ("39/41 live; 2
blocked — why"), what you dropped and why, source bugs found, and the cleanup
passes offered.
Sources
Looker
- Controls:
dashboard_filters in dashboard.json, in its row order; each
tile's listen names the filters it obeys, and a listener overrides the
tile's own pinned filter.
- Formats:
value_format_name for values, label_value_format for labels;
show_totals_labels, y_axes (sides, showLabels), series_cell_visualizations
(data bars), and pivot total/row_total.
- Header tiles often render a LookML
html: template the bundle lacks; look in
the project's LookML, or flag the missing fields.
- Looker draws a null dimension value as
∅ (legend, axis, table cell). Keep
it, COALESCE(<dim>, '∅') (cast a non-string dimension to a string first),
rather than inventing Unknown or No segment.
offset(x, k) and offset_list(x, start, n) step through the result's rows
in the query's sorts. With a date sorted descending, +1 is the row before:
mean(offset_list(x, 0, 7)) is this day and the 6 before it, AVG(x) OVER (ORDER BY date ROWS BETWEEN 6 PRECEDING AND CURRENT ROW). A window of N rows
is N − 1 PRECEDING.- Merged results and table calculations: one query, window functions. Every
merged query's fields stay on the tile (a merged-in target or goal is the
merge's point): join the queries on
merge_fields.
- Symmetric aggregates and
convert_tz are on every query; pass 2 and pass 1.
Sigma
- Hidden pages are data prep: fold their SQL into the chart queries; don't render
them. Their
WHERE holds workbook-wide rules.
- A column marked
[hidden: true] in the outline is not drawn: no series, no
table column. A hidden Goal = 0.85 is no goal line.
- A list control with
mode="exclude" is NOT IN; label it "Exclude …", and
decide null rows on purpose.
- A control's
targets reach every element built from the target's
source chain.
MovingAvg(x, 0, 4) is current row plus 4 following. A "rolling" label
means trailing: write ROWS BETWEEN 3 PRECEDING AND CURRENT ROW and say so.
MovingAvg(x, n) already trails.- Date-range controls are relative and UTC: the variable's
default: is the
matching preset, applied with filter_date_range. "Last N days" →
last_N_days; "last N including this " → last_N_<unit>
(calendar-aligned: the current unit plus the N−1 before it); "excluding this
" → previous_N_<unit>.
- A table's
summary: [ids] names columns Sigma shows as totals in a bar
above the table (# Open Tickets = CountDistinct([Url Link])). Each is a
KPI over the table's rows with the table's filters, placed in a row directly
above the table, titled with the column's name. Don't drop them.
- KPI
comparison.display: delta is value − target; absent means percent
difference. Carry dataLabel: shown and totals: shown; skip values=[]
and disabled element filters.
Hex
- Input parameters are the controls; relative date defaults carry a timezone.
- SQL cells chain: a cell can select from an earlier cell's dataframe, and use
Jinja parameters. Inline the chain into the chart queries.
png/ holds one render per chart cell, not the whole app; layout comes from
outline.md.- A dropdown whose options come from a dataframe column gets data options.
Omni
- Dashboard filters list every control; duplicates with ids are distinct
controls. Fiscal flags on time filters change the window.
source.json query_timezones is pass 1's source timezone.- Topics and the semantic model carry joins the SQL only reflects; read the
compiled SQL, and note the dbt model it should read from.
queries/<id>.sql is the warehouse query, runnable as is. A tile with a
post-step: outline line also has queries/<id>.post.sql, DuckDB over that
result (step_ref__1): the tile's final shape is computed there, so fold its
logic into your own SQL.
Screenshots
- Say up front what a screenshot cannot tell: controls empty by default, hidden
filters, exact formats, totals off-screen, SQL.
- Read values as expectations, not answers: the image is a stale snapshot. Read
its date range off the axes, match on grain, units and magnitude, and never
bend a correct query to reproduce a stale number.
- A wild mismatch (335 vs 7M) is a wrong table or query, not drift.
Common mistakes
| Mistake |
Fix |
| Stopping at the phase seam with no question |
Small board: keep going. Big board: announce the checkpoint, end phase 1 with the question |
| Picking the SQL mode yourself |
Ask once, before any YAML, unless the caller set it |
| Dropping controls empty by default, or wiring them to the wrong tiles |
The raw definition's filters and listeners are the list |
| Rolling 12 months instead of the source's window |
The source's default window as the variable's preset default: |
| Copying the source's look (emoji, forced tick formats, labels on every point, dual axes, bottom legends, fixed widths) |
dbt Charts defaults; override only with a reader-facing reason in notes: |
| Reworded metric names, or losing time of day |
Keep the meaning of every name; read the type per column from the raw definition |
| Inventing totals, or dropping them |
Totals exactly where the source shows them |
| Truncated wide tables, header tiles without fields and links |
Full width, every column, every line and link |
| Tab-only filters on every tab |
Nested-board variables: on that tab |
| Migrating hidden or graveyard pages |
List them as dropped |
| Copying a forward-looking moving average |
Trailing window, and say so |
| Cleaning SQL before parity, or unasked |
Parity first; passes are offers |
| Delivering with validate errors |
Fix every one first |
| Deleting files to "start clean" |
Write only the target board |
| Copying the source's colors and fonts |
Theme only; tokens for fixed meanings |
| A callout for a heading, note or README |
The section's title, notes: or a plain text tile |
| Grouped bars where the source stacks them |
The source's stacking, from the raw definition |
Keeping a leading # (# Bugs out of SLA) |
Drop it (Bugs out of SLA): the number already says it is a count |
| Copying the source's number or date pattern |
The kind's built-in name, or no format: for counts and dates |
Rationalizations to resist
| Excuse |
Reality |
| "Phase 1 is a natural place to hand back" |
Only if you announced the checkpoint and asked. An unannounced stop reads as finished. |
| "It'd be cleaner as an 8-chart summary" |
The user asked for that dashboard. Condensing is a silent failure. |
| "That control is empty, nobody uses it" |
It is in the source; readers set it. Keep it. |
| "Last 12 months is close enough" |
Every count moves. Use the source's window. |
| "The README says filters apply everywhere" |
The definition decides; the README can be wrong. |
| "This SQL is ugly, I'll tidy it while I'm here" |
Mode decides. Cleanups that change shape are offers after parity. |
| "The source number looks wrong, I'll fix it" |
Flag it with both numbers; fix only on a yes. |
| "Close enough — most tiles are there" |
"Most" is not a tally. Every tile is live, blocked, or flagged. |
1---2name: board-migrate3kind: workflow4description: >-5 Migrate a dashboard from another BI tool (Looker, Sigma, Hex, Omni) or a screenshot6 into a dbt Charts board: the same structure, controls, data and metric names, in dbt7 Charts' own visual design, proven by a parity table. Reads a source bundle (outline, compiled8 SQL, renders, KPI values) or images. Use for 'migrate', 'replicate', 'recreate',9 'port this dashboard', 'move off Looker', a BI dashboard URL, or an attached dashboard10 image. Do NOT use for building from scratch, or for copying a board already in this11 project (chart).12metadata:13 source: https://skillmd.com/skills/dbt-labs/board-migrate14 author: fivetran15---1617# Board migrate1819The user wants an existing dashboard (a Looker, Sigma, Hex or Omni page, an20export, a screenshot) as a dbt Charts board. This is a migration, not a21redesign. **Set your design opinions aside for the whole job**: the22one-screen/≤8-visualization guidance in `{{ s_skill_chart }}` does not apply,23chart-choice preferences do not apply, "this would be cleaner as…" does not24apply. The source is the spec. A 40-tile source means a 40-tile board.2526Work from the source's own files, never from memory of what the dashboard27"probably" shows. **Write only the target board**: never delete, move or28overwrite project files, the bundle, or anything you did not create.2930## Getting a bundle3132A **source bundle** is a directory with one layout for every tool.33{{#if_surface cli}}For supported tools, fetch one (credentials come from34environment variables; `--help` names them):3536```bash37dct import looker <dashboard URL or id> # LOOKER_CLIENT_ID / _SECRET38dct import sigma <workbook URL or id> # SIGMA_CLIENT_ID / _SECRET; --list <text> to find one39dct import hex <project URL or id> # HEX_API_TOKEN; --list40dct import omni <dashboard URL or id> # OMNI_API_KEY; --list41```4243Each writes `./<tool>-<id>/` (`--out` to change it) and prints the path.4445### API keys4647`dct import` reads keys from the environment only. When one is missing,48follow the project's own instructions for keys if it has them (an `AGENTS.md`,49a skill, a `.env.example`). Otherwise ask once: a gitignored `.env` at the50project root (offer this), or their own way (shell profile, a secrets51manager), which you then follow. For a `.env`:52531. Confirm `git check-ignore .env` prints `.env`; if not, add `.env` to54 `.gitignore` first.552. Append the variable names the tool needs, values empty56 (`LOOKER_CLIENT_ID=`), without touching lines already there.573. Open it for them (`code .env`, or their editor) and tell them where the58 tool's keys come from: Looker → Account → API keys (an admin may need to59 enable them); Sigma → Administration → Developer Access (a Sigma admin60 creates them; also set `SIGMA_API_BASE` for the org's region); Hex and61 Omni → the workspace's API token settings. With a bare id rather than a62 URL, also set `<TOOL>_BASE_URL`. Values go in single quotes63 (`LOOKER_CLIENT_SECRET='…'`) so the shell keeps `$` and spaces.644. Once they say it is saved, load it in the same command as the import:65 `set -a; . ./.env; set +a; dct import looker <URL>`.6667Never read, print or `cat` `.env` or a key.68{{/if_surface}}If the user already has a bundle, use it. For any other tool,69either write a small fetcher against its API that emits the layout below, or70work from screenshots (§ Sources → Screenshots). Never write a credential71value into a file, commit or chat yourself.7273## Bundle layout7475| Path | Use it for |76|---|---|77| `outline.md` | **Read first.** Pages → tiles in reading order: kind, title, grid position, encodings, formats, filters, controls and which tiles each control reaches. A digest, not the truth |78| raw definition (`dashboard.json`, `contents.json`, `project.hex.yaml`) | **Authoritative.** Grep it whenever the outline is silent or ambiguous: control modes, label formats, totals, axis ranges, hidden flags, text-tile templates |79| `queries/` | The source's compiled SQL per tile. Source tables, business rules, and the workbook-wide filters the outline never shows |80| `png/` | The source's own render of each page (Hex: each chart cell). The visual target; look at every one before writing YAML |81| `kpi/` | Current value of each single-number tile. Your parity numbers |82| `source.json` | Tool, URL, fetch time, and extras such as `query_timezones` |8384A screenshot-only bundle has `png/` and `source.json`, nothing else.8586A tile or image the import could not fetch is named in `outline.md` with the source's error.8788## Modes — ask once, before any YAML8990Ask one question up front, unless the caller already set it: **keep the91source's SQL verbatim, or rewrite it clean?** Never pick silently.9293- **Verbatim.** Each tile keeps the source's compiled query, changed only where94 variables and the project's table qualifiers require. Faithful first step;95 every cleanup is then an offered pass.96- **Clean.** Rethink each query from what its chart needs and write it fresh97 over the project's models, applying the clean-mode rules in § Rules. The98 source's SQL is evidence of what each number means, never a template.99 Nothing that changes a value.100101Parity (§ Prove it) is the acceptance test in both modes. On a large board102(below) the structure checkpoint is the only other question; the cleanup offers103come after parity. Three questions at most.104105## Two phases, one job — do not hand back at the seam106107Work in two phases: **the look on placeholder data first, real data second.**108The phase-1 board doubles as your notes: every value you read off the source is109recorded as inline data, ready to check phase-2 queries against. With a bundle110that has `queries/` and `kpi/`, phase 1 is quick; do not skip it.111112The phases are your working order, not a delivery boundary. **Run straight113through both and deliver a board on live data.** Nothing runs between turns:114stopping after phase 1 without a question ends the job with invented numbers.115116- **Roughly ten or fewer tiles that need a query** — no check-in.117- **More than that** — say up front you'll build the structure on placeholder118 data and come back before wiring queries. Deliver phase 1, ask whether the119 structure is right, and wire the queries as soon as they say go.120121A phase-1 board is never "migrated": call it "phase 1 of 2 — structure only,122every number is a placeholder", and end it with a next step or a question.123124## The fidelity contract125126Data faithful, visually default.127128**Copy from the source (the data and what it means):**129130- Pages, sections, tile order, and every tile's chart type, orientation and131 stacking (stacked, grouped, 100%) exactly as the raw definition states:132 a stacked bar stays stacked. dbt Charts groups a colored bar by default, so a133 stacked source needs `style:` `stack: zero` (100%: `stack: normalize`)134- Metric and dimension names: the words that carry meaning in titles, series,135 columns and controls. Strip decoration: emoji, a leading `#`, `Sum of …`/`Count136 of …` generator prefixes, and typos (fix the spelling)137- Every control, its label, default and the tiles it reaches138- Data semantics: metrics, dimensions, grain, filters, sort, date window, totals139- Text tiles: every line, field and link140141**Keep dbt Charts' defaults (do not match the source's look):** colors, fonts,142spacing, gridlines, title casing, tick formats and rotation, legend position,143data labels, column widths, axis titles, and number formats (compact by144default). Override a default only for a reason the reader would miss without145it, and say why in the chart's `notes:`. "The source does it" is not a reason.146- Color: only for a fixed meaning that is in the board (a target, a threshold,147 good/bad), with theme tokens, never hex.148- Data labels: only when there are five or fewer marks, or one value is the point;149 never on every point of a series.150- Dual axes: never by default. Two measures on different scales (a count and151 hours, thousands and tens) become two charts side by side on the same query;152 a reader compares their shapes, not their values. Several noisy series on two153 scales become an index chart (each series over its own period-average154 baseline, one axis) or small multiples.155- Precision: keep a source format only when its precision means something156 (a rate to one decimal); otherwise use the built-in name for the kind157 (`currency_compact`, `integer`, `percent`). A KPI tile is the exception:158 its number is the content, so it keeps the source's digits (`currency_whole`,159 `integer`) and is compact only when the source itself abbreviates.160- No invisible layers or helper columns to fake a feature (an axis floor, stack161 totals). Note the gap instead.162- Never invent data. A table the warehouse will not read, a query that fails,163 a value you can only see in the screenshot: the chart stays blocked with a164 `notes:` naming what is missing. No typed-in values, no `UNNEST([STRUCT(...)])`165 or `generator` rows, no "placeholder" or "fake data" banners. A board that166 shows a number must have run the query that produced it.167- `warnings_ignore` needs a reason in `notes:`. Fix copy-edit warnings by fixing168 the text.169- YAML in block style: every mapping key on its own line, never an inline170 `{ position: right }`. Inline lists (`[a, b]`) are fine.171172## Phase 1 — structure on placeholder data173174### 1. Plan and banner175176Write the mapping in chat first: page → tab or section, tile → chart name and177type, control → variable, and what you drop and why. Then open a **new** board178whose first and last rows are warning callouts:179180```yaml181charts:182 fake_data_warning:183 type: callout184 title: "Fake data"185 message: >-186 This board mirrors the source dashboard's structure. Every number below187 is a placeholder read off the source; no live query is wired yet.188 style:189 tone: warning190rows:191 - fake_data_warning192 # Rebuild the source sections here.193 - fake_data_warning194```195196Both callouts stay until phase 2 has wired every tile; then delete them.197198### 2. Rebuild every tile with inline values199200Section by section, give each tile an inline `values:` query holding what the201source shows (KPIs exactly from `kpi/`, lines and bars as a handful of points,202tables as headers plus a few rows) and a chart that matches the source tile:203204```yaml205queries:206 weekly_active_orgs:207 notes: "Phase-1 placeholder — values read off the source"208 columns: [week, active_orgs]209 values:210 - [2026-06-01, 210]211 - [2026-06-08, 240]212```213214**Options to copy deliberately**, each checked against the raw definition, not215only the PNG: orientation; stacking; which column splits series; sort; date216grain and window; KPI comparison, target and tone; table columns and page size;217totals; the hover card (a source tile's tooltip columns become the chart's218`tooltip:` list on bar, line, area, scatter and pie, in the source's order, with219the source's format when it differs from the column's). Everything visual220beyond that starts from the dbt Charts default.221222### 3. Iterate until it looks right223224Render after every tile (`{{ s_skill_chart }}` owns the build-validate loop —225one tile at a time, never one-shot). Then render the whole board{{#if_surface cli}}226to PNG, every tab, and put each next to its `png/` page. A render shows one227tab: give `tabs:` an `id:` and pass each tab's slug (its title, lowercased,228punctuation dropped, spaces and hyphens as `_`) as that variable, and fix every error on every tab:229230{{ s_render_png_example }}{{/if_surface}}{{#if_surface tool}} with231`{{ s_render_board }}` and compare its chart list with the source's tiles{{/if_surface}}.232233Build the board in this session. If you hand pieces to sub-agents, wait for234every one and assemble its work before you finish; a session that ends with235work pending leaves an unfinished board.236237Close phase 1 with a tally: "8 sections, 41 tiles — 41 rebuilt." A tile you238cannot represent is **flagged to the user now, never silently dropped**.239240## Phase 2 — wire real data241242### 4. Find the tables243244With a bundle, `queries/` names the source tables: read from the same model the245source reads, never rebuild its logic from upstream tables. Read any hidden or246data-prep element's SQL first; its `WHERE` holds the workbook-wide rules.247Without SQL, explore the warehouse with `{{ s_execute_sql }}` against248INFORMATION_SCHEMA.249250### 5. Swap tile by tile251252Replace each placeholder with its real query, in the chosen mode, validating and253re-rendering as you go. In clean mode each chart gets its own query, written254from its intent (see Clean-mode SQL); in verbatim mode it keeps its tile's255compiled query. Name every query for what it returns (`arr_by_month`),256never by a source tile or element ID. A tile with no plausible source keeps its257placeholder and is marked **blocked**; keep going.258259Fix every validate and render error before delivering; never hide one with260`--allow-chart-errors`. Remove the banner only when every tile is live or261flagged.262263## Rules264265Each rule is one a reviewed migration showed being broken.266267**Controls**268- Keep every source control, including ones empty by default — the raw269 definition is the list, not the PNG's filter line.270- Wire each control to exactly the tiles it reaches (`listens`, `targets`, and271 the children of a targeted parent); a tile no control reaches stays unfiltered.272- Scope a page-only control to its tab (nested-board `variables:`); a273 board-wide variable shows on every tab. A control that sits in the page above274 a group of tiles becomes the `variables:` of an inline board holding those275 tiles (the `rows`/`cols` entry with its own `variables`, `queries` and276 `charts`), so it appears where the source puts it. Only a control the source277 places at the top of every page goes in the board's top-level `variables:`.278- Name variables for what they set; options from the data, `static:` only for279 true enums; multiselects get `default: []`. Labels are the source's.280- The default window is the source's (30 days stays 30 days, not 28 or a281 rolling 12 months): wrong windows move every number.282283**What the reader sees**284- Titles and labels keep the source's meaning in the theme's casing, without285 decoration. The SQL mode goes in `notes`, not titles.286- Source text: a heading is its section's `title`, a note or description is287 `notes:` or a plain text tile, a README page is a text tile. The finished288 board has no `callout`.289- Formats: the built-in name for the value's kind (`currency_compact`,290 `integer`, `percent`, `id`) on charts; a KPI headline keeps the source's291 digits (`currency_whole`, `integer`). Keep the source's precision only when it292 means something. The source's `value_format_name`/`formatString` tells you293 the kind and the unit, not the exact print. Currency stays currency and a rate294 stays a percent; a plain count or a date takes no `format:`. Never write the295 source's pattern (`,d`, `$#,##0.00`, `%m/%d/%Y`).296- Axis ranges: the default, unless the source sets one (Looker `minValue`/297 `maxValue`, Sigma axis bounds) or a zoom is the point (an uptime chart near298 100%); say so in `notes:`. Both bounds set: `scale: continuous: domain: [min,299 max]`; only a minimum above zero: `scale: continuous: zero: false`. A pinned300 domain that clips filtered data is a bug.301- Totals only where the source shows them, and visible on page one when it does.302 A table shows a total row only when its source says so: Looker, the tile's303 query has `total: true` (`row_total: right` adds a total column; the304 `vis_config` `show_totals` toggle alone draws nothing); Sigma, the element305 lists `axisTotals` or `totals:` (`totalPosition: first` puts it on top).306 Otherwise the table has none. A total row comes from its query307 (`GROUP BY ROLLUP` or `GROUPING SETS`) with a role column,308 `IF(GROUPING(<dim>) = 1, 'total', 'value') AS row_role`,309 and `row_role: row_role` on the table chart, so the table styles it as a total310 row with no row number. Its label cell reads `Total`. Sigma's own total joins311 are never copied, but every total the source shows is rebuilt with that312 `ROLLUP` and `row_role` form (a pivot's `totals:` or `axisTotals` with313 `visibility: shown` counts as shown); a board that drops a shown total is314 incomplete, not a gap to note.315- Data bars (Looker `series_cell_visualizations`, Sigma data bars): a table spark316 bar prints no number, so where the source shows data bars, show the value as its own column and the bar in a317 second column right after it (select the value twice, `n` and `n AS n_bar`;318 the bar column's label empty).319- Text and header tiles keep every line, field and link; README prose keeps320 its content, with typos fixed.321- Wide detail tables keep every row and visible column, readable: full width,322 `max_width`s, no `LIMIT` the source lacks.323- Timestamps keep time of day; dates keep their year.324- KPI targets carry good/bad tone (`percent_delta` with `tone`); visible KPI325 descriptions are drawn text, never `notes:`.326327**Scope and evidence**328- Skip hidden, graveyard, draft and "to deprecate" pages; list them as dropped.329- Trust the definition over README prose: a README can be false; keep it330 verbatim and list the false sentences.331- The source can be wrong (fan-out, a mislabeled axis, a forward-looking moving332 average). Flag it with both numbers; fix it only with the user's yes.333334**Clean-mode SQL** (always on in clean mode; none changes a value)335336BI tools generate SQL for a semantic layer: they join every table an explore337might need and then de-duplicate, compute one wide base for many tiles,338protect every aggregate against fan-out, and convert time zones and format339labels in every query. None of that belongs on a board. Per chart:340- Write down the chart's intent first (measure and its definition, grain,341 dimensions, filters), from the compiled SQL and the source's field names.342- Query the narrowest existing model that has those columns, directly, at the343 chart's grain. Never a shared *pre-aggregated* base or CTE spine feeding many344 charts. One exception: when three or more charts need the same joins and345 filters, write one row-level base (joins and shared filters, no `GROUP BY`)346 and have those charts aggregate `FROM {{ queries.<base>.cache }}`. Don't347 repeat the same join block in every chart.348- One base query, read through the cache: a Sigma data model or Looker derived349 table that feeds many tiles is written once as a named query, and each tile350 reads `FROM {{ queries.base.cache }}` with a plain `GROUP BY` or filter in351 DuckDB SQL. `{{ queries.base }}` inlines the base into every tile, so each352 tile re-scans the warehouse. A base that scans tens of GB or returns far more353 rows than the tiles need is a model, not a board query: flag it to the user.354- Grouped tables (Sigma `groupings`, shown as `grouping:` lines in the outline;355 Looker has no equivalent) are drill-downs. Migrate the level the page shows:356 collapsed groups are one `GROUP BY` at the group grain with the group's357 calculations as aggregates; expanded groups are detail rows with the group358 columns first. One plain query; never port the self-joins, `rank`,359 `__Ordering`/`sort_` helper columns or `limit 1000` in Sigma's SQL.360- `{{ queries.x }}` inlines as `(…) AS x`: refer to its columns as `x.col` and361 never write a second alias after it (`FROM {{ queries.x }} AS r` fails to362 parse).363- Join only tables whose columns are selected or filtered; no join-then-undo.364 Filter with a plain `WHERE`, not an `EXISTS` subquery a join or column filter365 can replace.366- No `COALESCE(SUM(x), 0)` or `IFNULL` around an aggregate unless the chart must367 print 0 for an empty group.368- Before dropping a `SUM(DISTINCT …)`/`COUNT(DISTINCT …)` guard, run the grain369 check on the joined rows (`SELECT COUNT(*), COUNT(DISTINCT key)`): equal →370 plain `SUM`/`COUNT`; different → aggregate at the right grain, then join.371- Date windows live on the board clock, not in SQL: set the board's time zone372 (and fiscal start month) once, and filter with373 `{{ filter_date_range('col', var_or_preset) }}` (a timestamp column is passed374 bare) or a daterange variable whose `default:` is a preset (`last_13_months`,375 `this_fiscal_quarter`). No `CURRENT_DATE('<zone>')` arithmetic per query.376 The source's default window is the variable's preset `default:`, fiscal377 included ("this fiscal quarter" → `this_fiscal_quarter`); never frozen dates.378 Fiscal windows are fiscal presets with the fiscal start month set once on the379 board; never `DATE_TRUNC(DATE_ADD(…, INTERVAL 11 MONTH), QUARTER)` math in SQL.380- Dates are typed at the grain; no `FORMAT_DATE`/`TO_CHAR` on an axis column.381- No display text built in SQL (`FORMAT('%.1fK', …)`, label columns, helper382 columns for axis floors): the chart's `format` and axis settings do that.383- Select only the columns the chart encodes; no `SELECT *` from a raw table.384- Variables: one per concept, named for what it sets, options from the data.385- Strip source commentary and generated aliases; name columns as a reader would.386- Pivots: return long format and let the table's `rows:`/`columns:`/`values:`387 pivot it; each pivot field its own `columns:` level, in the source's order.388389**Cleanup passes** (verbatim mode only: clean mode already applies them).390Offered after parity holds, in this order, one at a time: "I can do X; here's391what it changes; go?"; applied only on a yes, re-run against parity, shown as a392diff; never applied unasked.3931. **Timezone.** Read the source's query timezone (`source.json`) and the394 warehouse session timezone (probe the adapter). Drop wrapping that converts395 nothing (same zone, or a `DATE` column); move the rest to the board's396 `regional.time_zone`.3972. **Fan-out precautions.** Before replacing a symmetric aggregate398 (`SUM(DISTINCT … MD5/HASH …)`) run the grain check on the joined set399 (`SELECT COUNT(*), COUNT(DISTINCT key)`) and report it. No fan-out → plain400 `SUM`/`COUNT`; fan-out → aggregate each side at its grain, then join.4013. **Pivot-then-aggregate.** One aggregation at the chart's grain; window402 functions replace table calculations.4034. **Re-source.** Read from the narrowest table or model that has the columns.404405Report cruft counts per pattern (timezone wraps, date strings, symmetric406aggregates, double aggregations, `SELECT *`, cross joins) before and after.407408## Prove it409410Deliver two tables; every mismatch gets a cause.411412| KPI | Source (`kpi/`) | Board | Δ | Cause if ≠ |413|---|---|---|---|---|414415| Tile | Rows / series | Matches? | Cause if not |416|---|---|---|---|417418Run the board at the source's defaults. Usual causes: late-arriving data since419the fetch, a different default window, a hidden-page rule you missed, a source420bug. When the bundle has `queries/`, re-run the source's SQL now and compare421against that, not only the snapshot. Then deliver the tally ("39/41 live; 2422blocked — why"), what you dropped and why, source bugs found, and the cleanup423passes offered.424425## Sources426427### Looker428- Controls: `dashboard_filters` in `dashboard.json`, in its `row` order; each429 tile's `listen` names the filters it obeys, and a listener overrides the430 tile's own pinned filter.431- Formats: `value_format_name` for values, `label_value_format` for labels;432 `show_totals_labels`, `y_axes` (sides, `showLabels`), `series_cell_visualizations`433 (data bars), and pivot `total`/`row_total`.434- Header tiles often render a LookML `html:` template the bundle lacks; look in435 the project's LookML, or flag the missing fields.436- Looker draws a null dimension value as `∅` (legend, axis, table cell). Keep437 it, `COALESCE(<dim>, '∅')` (cast a non-string dimension to a string first),438 rather than inventing `Unknown` or `No segment`.439- `offset(x, k)` and `offset_list(x, start, n)` step through the result's rows440 in the query's `sorts`. With a date sorted descending, +1 is the row before:441 `mean(offset_list(x, 0, 7))` is this day and the 6 before it, `AVG(x) OVER442 (ORDER BY date ROWS BETWEEN 6 PRECEDING AND CURRENT ROW)`. A window of N rows443 is N − 1 PRECEDING.444- Merged results and table calculations: one query, window functions. Every445 merged query's fields stay on the tile (a merged-in target or goal is the446 merge's point): join the queries on `merge_fields`.447- Symmetric aggregates and `convert_tz` are on every query; pass 2 and pass 1.448449### Sigma450- Hidden pages are data prep: fold their SQL into the chart queries; don't render451 them. Their `WHERE` holds workbook-wide rules.452- A column marked `[hidden: true]` in the outline is not drawn: no series, no453 table column. A hidden `Goal = 0.85` is no goal line.454- A list control with `mode="exclude"` is `NOT IN`; label it "Exclude …", and455 decide null rows on purpose.456- A control's `targets` reach every element built from the target's457 `source` chain.458- `MovingAvg(x, 0, 4)` is current row plus 4 **following**. A "rolling" label459 means trailing: write `ROWS BETWEEN 3 PRECEDING AND CURRENT ROW` and say so.460 `MovingAvg(x, n)` already trails.461- Date-range controls are relative and UTC: the variable's `default:` is the462 matching preset, applied with `filter_date_range`. "Last N days" →463 `last_N_days`; "last N <unit> including this <unit>" → `last_N_<unit>`464 (calendar-aligned: the current unit plus the N−1 before it); "excluding this465 <unit>" → `previous_N_<unit>`.466- A table's `summary: [ids]` names columns Sigma shows as totals in a bar467 above the table (`# Open Tickets = CountDistinct([Url Link])`). Each is a468 KPI over the table's rows with the table's filters, placed in a row directly469 above the table, titled with the column's name. Don't drop them.470- KPI `comparison.display`: `delta` is value − target; absent means percent471 difference. Carry `dataLabel: shown` and `totals: shown`; skip `values=[]`472 and disabled element filters.473474### Hex475- Input parameters are the controls; relative date defaults carry a timezone.476- SQL cells chain: a cell can select from an earlier cell's dataframe, and use477 Jinja parameters. Inline the chain into the chart queries.478- `png/` holds one render per chart cell, not the whole app; layout comes from479 `outline.md`.480- A dropdown whose options come from a dataframe column gets data options.481482### Omni483- Dashboard filters list every control; duplicates with ids are distinct484 controls. Fiscal flags on time filters change the window.485- `source.json` `query_timezones` is pass 1's source timezone.486- Topics and the semantic model carry joins the SQL only reflects; read the487 compiled SQL, and note the dbt model it should read from.488- `queries/<id>.sql` is the warehouse query, runnable as is. A tile with a489 `post-step:` outline line also has `queries/<id>.post.sql`, DuckDB over that490 result (`step_ref__1`): the tile's final shape is computed there, so fold its491 logic into your own SQL.492493### Screenshots494- Say up front what a screenshot cannot tell: controls empty by default, hidden495 filters, exact formats, totals off-screen, SQL.496- Read values as expectations, not answers: the image is a stale snapshot. Read497 its date range off the axes, match on grain, units and magnitude, and never498 bend a correct query to reproduce a stale number.499- A wild mismatch (335 vs 7M) is a wrong table or query, not drift.500501## Common mistakes502503| Mistake | Fix |504|---------|-----|505| Stopping at the phase seam with no question | Small board: keep going. Big board: announce the checkpoint, end phase 1 with the question |506| Picking the SQL mode yourself | Ask once, before any YAML, unless the caller set it |507| Dropping controls empty by default, or wiring them to the wrong tiles | The raw definition's filters and listeners are the list |508| Rolling 12 months instead of the source's window | The source's default window as the variable's preset `default:` |509| Copying the source's look (emoji, forced tick formats, labels on every point, dual axes, bottom legends, fixed widths) | dbt Charts defaults; override only with a reader-facing reason in `notes:` |510| Reworded metric names, or losing time of day | Keep the meaning of every name; read the type per column from the raw definition |511| Inventing totals, or dropping them | Totals exactly where the source shows them |512| Truncated wide tables, header tiles without fields and links | Full width, every column, every line and link |513| Tab-only filters on every tab | Nested-board `variables:` on that tab |514| Migrating hidden or graveyard pages | List them as dropped |515| Copying a forward-looking moving average | Trailing window, and say so |516| Cleaning SQL before parity, or unasked | Parity first; passes are offers |517| Delivering with validate errors | Fix every one first |518| Deleting files to "start clean" | Write only the target board |519| Copying the source's colors and fonts | Theme only; tokens for fixed meanings |520| A callout for a heading, note or README | The section's `title`, `notes:` or a plain text tile |521| Grouped bars where the source stacks them | The source's stacking, from the raw definition |522| Keeping a leading `#` (`# Bugs out of SLA`) | Drop it (`Bugs out of SLA`): the number already says it is a count |523| Copying the source's number or date pattern | The kind's built-in name, or no `format:` for counts and dates |524525## Rationalizations to resist526527| Excuse | Reality |528|--------|---------|529| "Phase 1 is a natural place to hand back" | Only if you announced the checkpoint and asked. An unannounced stop reads as finished. |530| "It'd be cleaner as an 8-chart summary" | The user asked for *that* dashboard. Condensing is a silent failure. |531| "That control is empty, nobody uses it" | It is in the source; readers set it. Keep it. |532| "Last 12 months is close enough" | Every count moves. Use the source's window. |533| "The README says filters apply everywhere" | The definition decides; the README can be wrong. |534| "This SQL is ugly, I'll tidy it while I'm here" | Mode decides. Cleanups that change shape are offers after parity. |535| "The source number looks wrong, I'll fix it" | Flag it with both numbers; fix only on a yes. |536| "Close enough — most tiles are there" | "Most" is not a tally. Every tile is live, blocked, or flagged. |