dbt Charts
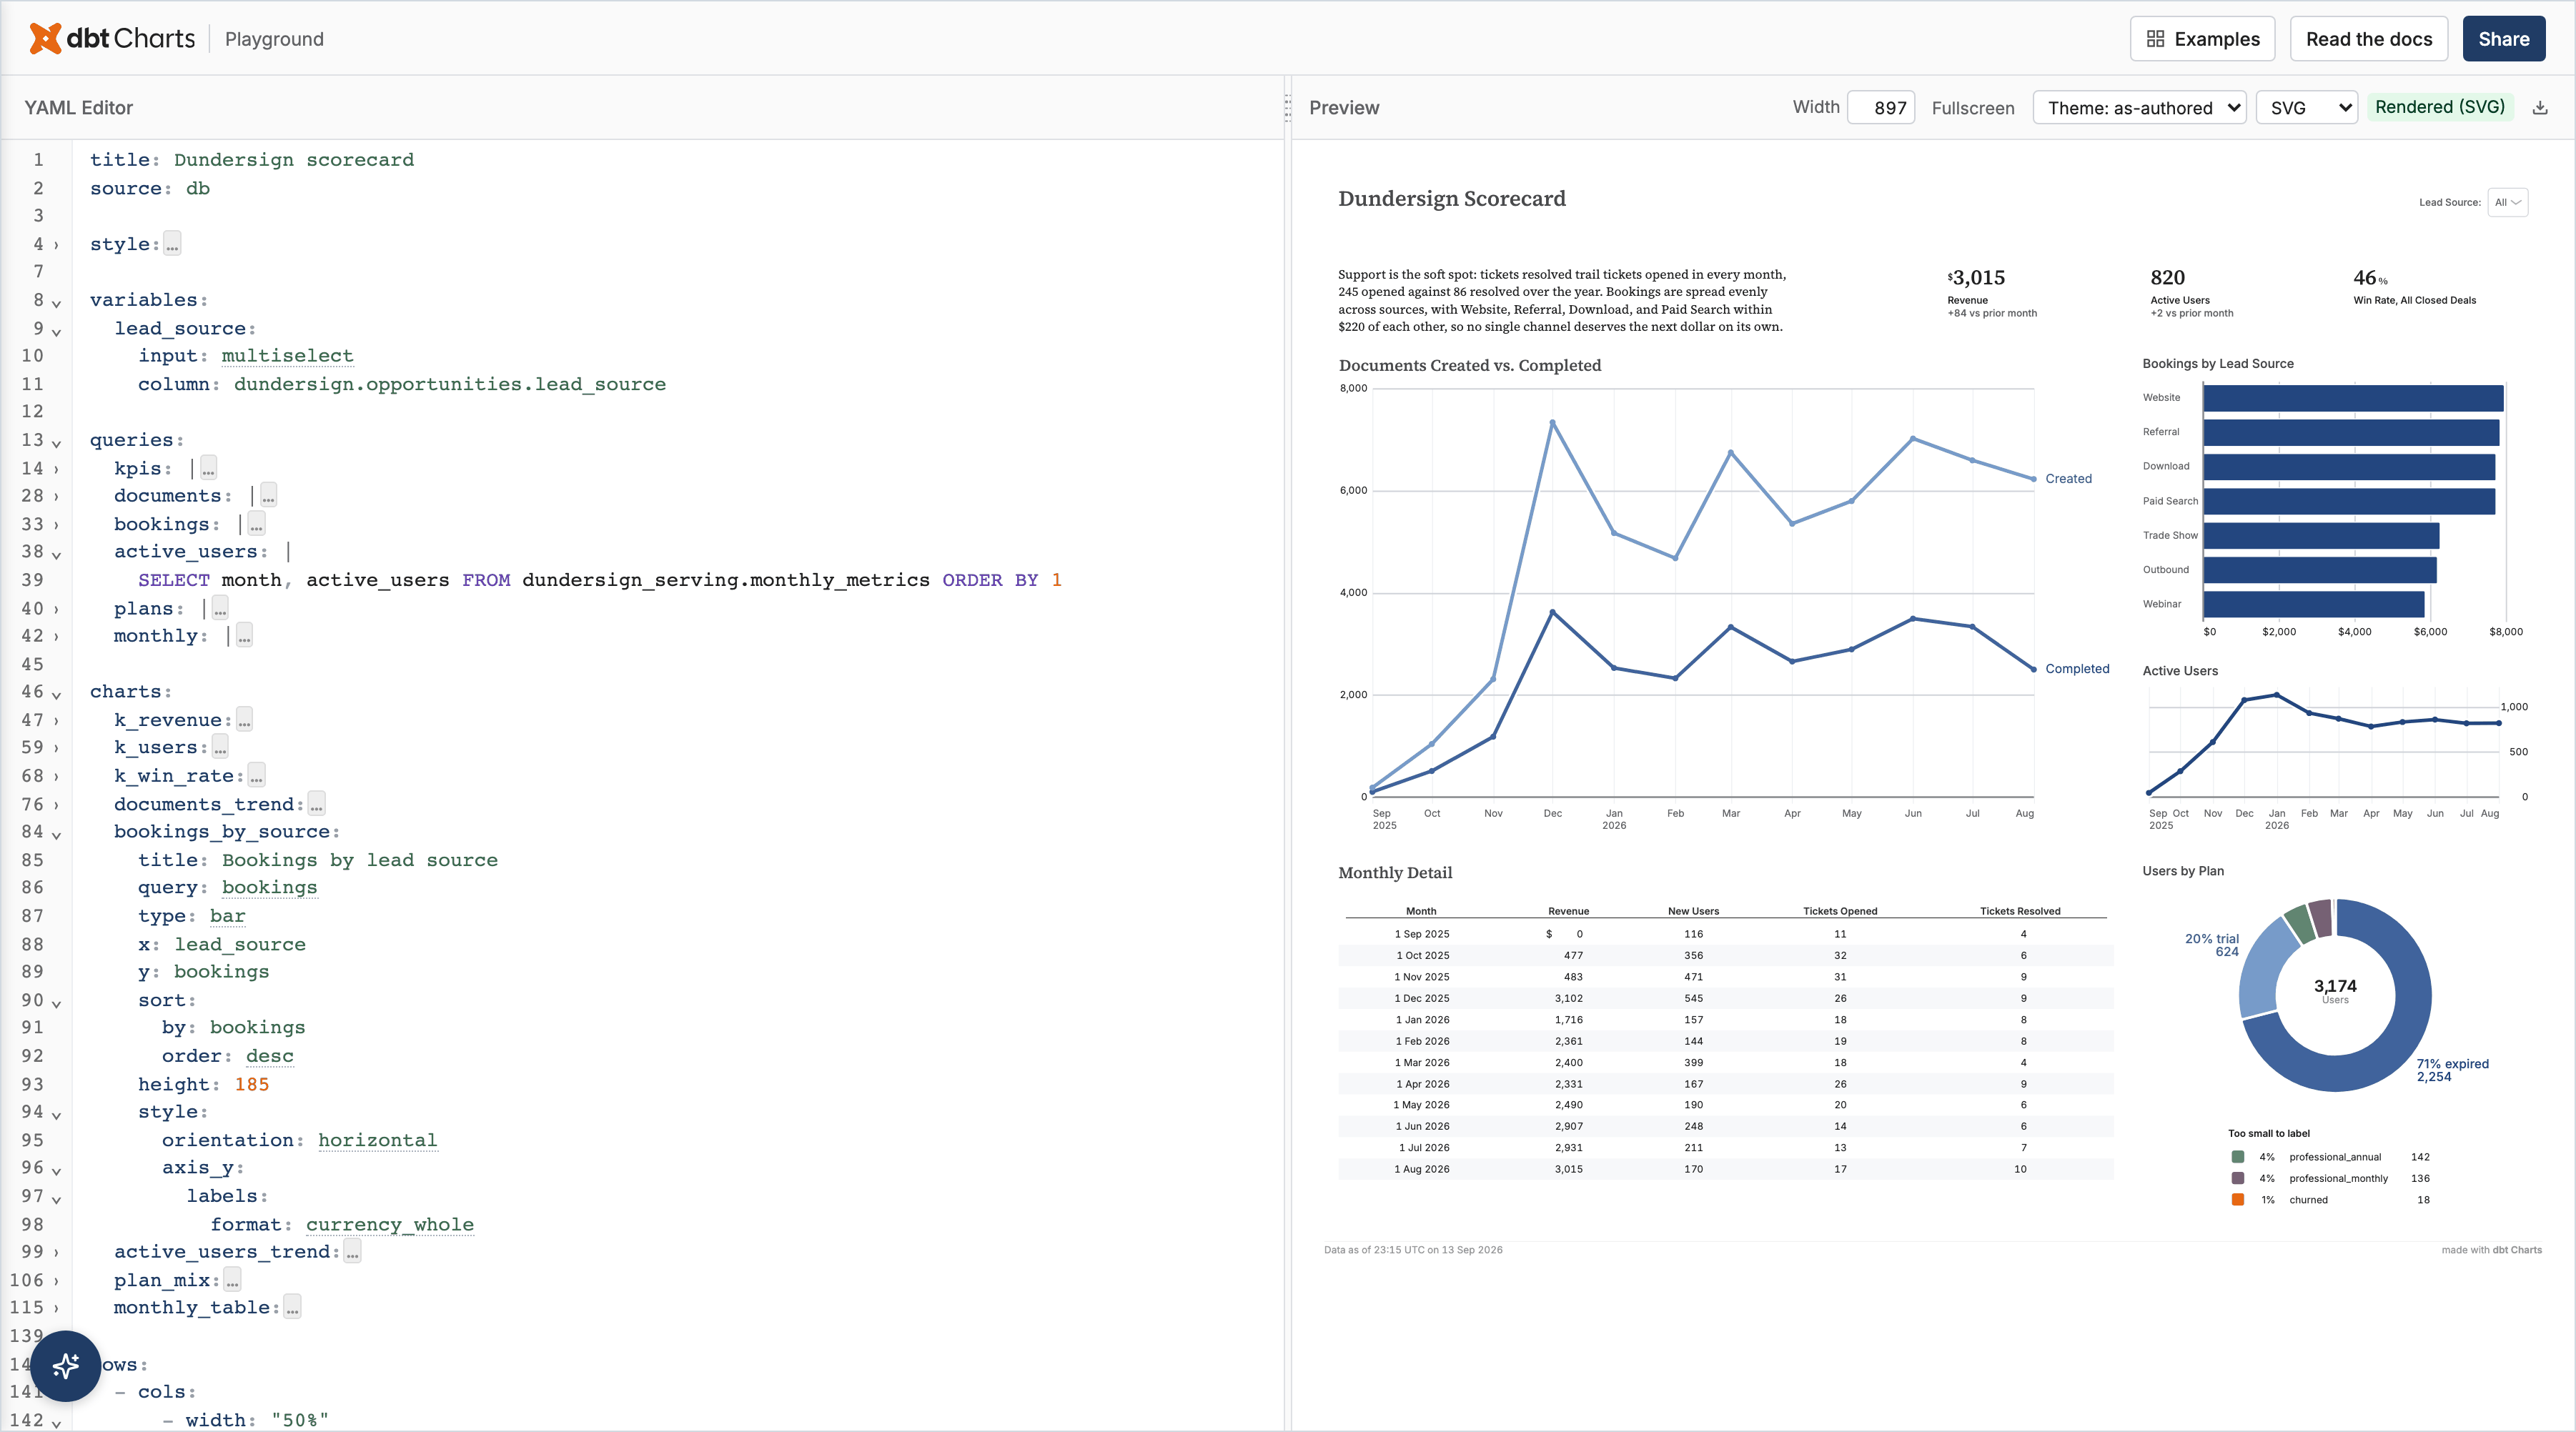
dbt Charts is markdown for dashboards: a terse spec where a few lines of YAML make an expressive board. These three pages are the whole spec; the Tools below are all you need, so never read package source. This page is the core grammar and themes; the styling page (get_skill('styling')) is the style surface; read it only for a look change or a warning naming a style key. Every list below is complete: an unknown key is rejected with the keys allowed there. SQL does the computing (one row per mark, aggregated, ordered and limited in the query); YAML binds columns to marks. Build boards, not plotting code. dbt Charts is the only visualization tool here: answer with boards, never another charting library.
Write only what differs from the defaults. Themes, frame and card sizes, number formats, column headers (a column's name, prettified), control types and option lists are chosen for you, often by the user's own theme; restating one changes nothing. Leave the look alone unless the user asks: their defaults beat your taste.
Data files (.csv, .json, .parquet) in the project root and data/ need no declaration: a board's source: is the file path (source: ./data/orders.csv) and the table is the file stem. A query sees only its own source: file, so never join across files: draw a second file through layers[].query. A database file (duckdb, sqlite) or warehouse is a sources: entry in dbt_charts.yml, whose type: for a warehouse is postgres, snowflake, bigquery, databricks. To see a source's tables and columns: execute_sql(source=SOURCE, sql="SELECT table_name, column_name, data_type FROM information_schema.columns").
Tools
| Tool |
What it does |
execute_sql(source=SOURCE, sql=SQL) |
Run SQL on a source; CSV under a byte budget, so use LIMIT. |
render_board(yaml_content=YAML) |
Run the board's queries and return what each chart draws (values, ranges, value labels), any problems, and the board's preview URL. |
search_files(text="") |
List the project's boards; a keyword searches them; each hit's board_path is what render_board takes as path. |
| Your host's file tools |
Read, write and change board files; render_board(path=BOARD) then checks the saved file. |
get_skill(name) |
Read another skill page. |
These are every tool a board needs.
Board
board (root or nested):
title: Heading shown at the top of the boardtext: A Markdown block, as Jinja over query results: {{ queries.totals.one.revenue }} for a one-row query, {{ queries.top.rows[0].name }} for row N. A value prints raw, so format it in SQL; titles and subtitles read the same waysource: Default source name for all queries in this boardvariables (map of mapping|text): Named inputs that parameterize queriesqueries (map of text|{}): Named result sets the charts draw fromcharts (map of mapping|text): Named chart definitionsrows (list of text|mapping|map of mapping): Vertical stack layout: list of chart names or inline chart/board definitionscols (list of text|mapping|map of mapping): Horizontal layout: list of chart names or inline chart/board definitionsgrid ({columns, items}): CSS-grid style layout with explicit row/column placementtabs ({id, position, default, items}): Tabbed navigation layout where each tab contains its own layoutwidth (text|int): Width when nested (e.g., '50%', '400px', or an integer in pixels)height (text|int): Height when nested (e.g., '300px' or an integer in pixels)style (mapping): Appearance overrides for this board (background, border, and more)extends (text|clarity|neon|paper|stark|vivid): Themes or board files to inherit; the last one wins
Also exist: notes, tags, aliases, html_policy, cache, incremental, card_gap, chart_focus, details, id, visible, links, regional.- Board can only have one layout type (rows, cols, grid, or tabs)
- Board must have at least one layout type, text, title, or chart
- Quote text that holds
: , is all digits, or is yes/no/on/off/1:30 (YAML 1.1), keys too: title: "Mix: 2006 vs 2015", label: "2009", "no": category[4].
- Anchors, aliases and
<<: merge keys work within one file; anchor on first use (no anchors: key).
Queries
queries.<name>:
sql: The SQL to run, as Jinja2. {{ queries.base }} inlines another query of the same source as a subquery already aliased to its name (add no AS), so base reruns inside every query that reads it; a bare FROM base fails. {{ queries.base.cache }} runs base once and composes over its cached rows in DuckDB SQL: use it when several charts read one expensive base. Variables go in through filter(), filter_date_range() or {{ name }}source (text|map of any): Source name reference, or an inline file path (e.g. ./data/sales.csv)notes: What this query returns; handed to tooling with its results, never drawnformats (map of name|text): A column's format, set once on its query, only where the default would misread (currency, percent, a unit); counts and plain numbers need none. Every chart showing the column follows it; a chart sets its own only to differ. A d3 spec is rejected
Also exist: ignore, cache, incremental, type, setup_sql, dialect.
Other query types: values (inline data authored as a list of row mappings, or inline data authored as column names plus positional row values), schema (dbt source schema query).
Jinja helpers in query SQL:
filter(column: str, value: Any, operator: str = '=', none: str = 'allow'): Filter clause {{ filter('col', var) }}; when the variable is All or unset it is no constraint, so never wrap it in {% if %}. A date value compares the column by its calendar date, so pass a timestamp column bare (no DATE() or wrapping subquery). none: Fallback when value is null/empty/_NullValue. 'allow' (default) returns '1=1' (no constraint, show all rows). 'deny' returns '1=0' (zero rows).filter_date_range(column: str, date_range: Any, is_naive_utc: bool = False): Date range filter {{ filter_date_range('col', range_var) }}. The column may be a date or a timestamp and compares by its calendar date, so pass it bare (no DATE(), CAST or wrapping subquery). The range may be a preset name literal such as 'last_30_days'. Pass is_naive_utc=true only for a naive timestamp column that stores UTC, to compare by its date in the board's regional.time_zone. date_range: [start, end] dates, or a preset name
Charts
charts.<name>:
query (text|{}): Where this chart reads its datatitle: Heading naming what the chart shows, in Title Case like every heading. Rejected on type: kpisubtitle: Supporting text beneath the chart title; a KPI uses support.label insteadx: X-axis column name from the query resulty (text|list of text): Y-axis column name(s)color: Column that splits the marks into colored series; on heatmap, the measure its cells are shaded by. Bare column name only; a literal color goes in style.color.staticsort ({by, order}): Which column orders the marks, and in which direction (asc/desc)x_label: X axis title, replacing the column-derived one (model_year reads "Model year")y_label: Y axis title, replacing the derived one (model_year reads "Model year")field_labels (map of text): Display text per query column in legends, tooltips and axis titleslayers (list of mapping): Extra marks on one shared x, each with its own typemultiples ({rows, columns, scale}): Small multiples by a rows column, a columns column, or bothwidth (int|number): Chart width in pixelsheight (int|number): Explicit chart height in pixelsstyle (mapping): Appearance overrides for this chart alone
Also exist: tooltip, id, notes, link, visible, type, warnings_ignore, support_table, pattern, y_start, annotations.
Name the SQL column as the axis should read (AS weight_lbs titles "Weight (lb)"); set x_label, y_label or field_labels only when the title must say more.
Name no channel on a chart whose query no other chart uses: the columns bind in order, dimensions first, measure last: bar, line, area: x, y or x, color, y; scatter: x, y or color, x, y; heatmap: x, y, color; pie, donut: theta or color, theta; kpi: value; histogram: x. A query other charts share stays top-level and its charts name x, y or color; never split a shared query so a chart can skip them.
Bar orientation, table pagination and sort are chosen from the data (horizontal category bars, largest first unless color splits them, else in the query's row order; pages only past one page's rows): write style.orientation, style.pagination or sort only to change that.
Every chart needs type:, one of those below.
bar: takes x, y, color, layers
y_start: Column each bar starts from instead of zero (waterfall, range, Gantt, lollipop)
line: takes x, y, color, layersarea: takes x, y, color, layersscatter: takes x, y, color, layers
size: Column used to size-encode data points (quantitative)shape: Column used to shape-encode data points (categorical)
histogram: takes x, colorheatmap: takes x, y, color; rejects layerskpi: rejects title, subtitle, x, y, color, sort, x_label, y_label, field_labels, layers, multiples, width, height
value: Column reference (string column name) for the headline number/textlabel: Caption naming what the headline value measures; style.variant places itglyph: Text shown before the headline value (e.g. '▲', '●')support ({value, label, glyph, good}): Secondary block, a delta, comparison, or note; style.variant places itbackground (text|map of any): Gradient background channel, {column, scale} shapeconditional_formatting (map of mapping): Discrete rule-driven style overrides indexed by column name
table: rejects x, y, color, sort, x_label, y_label, field_labels, layers, multiples, width, height
rows (list of text): Fields whose distinct values form the row dimension of a pivot cross-tabcolumns (list of text): Fields whose distinct values become column headers in a pivot cross-tabvalues (list of text): Measure fields that fill pivot cellsconditional_formatting (map of mapping): Discrete rule-driven style overrides indexed by column name
callout: requires message; takes title; rejects query, subtitle, x, y, color, sort, x_label, y_label, field_labels, layers, multiples, width, height
message: Body text the callout displays
Also exist: pie, donut, point_map, bubble_map, map, geoshape, spark_bar, custom.
For a shape no built-in type draws, read the custom-chart-build skill.
- A table is as tall as its rows and takes no
height: style.pagination.page_rows caps the rows shown; a height on the layout row around it caps its slot.
a table's style:
hide_underscore_columns (bool): Hide query columns whose names start with an underscore, such as a _flag computed for a conditional rule or _fivetran_synced. A hidden column's values still feed rules and links, and a column with its own style.columns entry always shows. Set false to show them
layers[]:
type (bar): Selects the layer's mark
y: Y-axis column name for this layer
x: X-axis column name for this layer
query: Query name for this layer's data (overrides chart-level query)
label: Name for this layer's measure wherever the layer is identified
color: Column whose values split this layer into colored series
style ({marks: {}}): Only marks: a line layer's color is marks: {line: {stroke: {color: '#hex'}}}, a scatter's marks: {point: {color: '#hex'}}
Also exist: axis_y, legend, y_start.
Layer types: bar, line, area, scatter.
y_start sets each bar's start, so it can't be stacked; remove style.stack or y_start.
A bar x reads up to 50 values: draw 120 months as a line, or roll them up in SQL.
Derived series (rolling averages, running totals, YoY) are window functions or extra columns, plotted as another y or a layers: entry. The delivered page is static: never caption anything as available "on hover".
annotations: (bar, line, area, scatter) are type: rule (a line at y: 25, y: avg(), x: <date>), band (from/to), note (at x and y) or trend (fit: linear()), each with text. One target value is a rule; a target per bar or period is the targets recipe. Peak note: y: max(), no x; never paste a result.
bullet, waterfall, lollipop, dumbbell, slope, bump, gantt, targets and pacers are recipes, never a type:: read them on the recipes page (get_skill('chart-recipes')) first.
Variables
A variable is an input on the page (a dropdown, slider or date picker) whose value a query reads by bare name: {{ region }}, never variables.region. Lead with column: table.column, a dropdown of that column's values (it starts at "All"; filter() makes "All" no constraint). Omit default. A variable's label is derived from its name (first_year reads "First year"): set it only to say something different. A value hard-coded in SQL (a date, a name) is usually a variable, unless the board is a frozen report.
A range bound is two variables on one column (column: cars.model_year), used as filter('model_year', first_year, '>=') and '<='; unset ("All") means no bound, so no default, data_type, input or static list.
A date range is one variable, not two input: date variables with hard-coded defaults: period: {column: t.order_date, input: daterange} read as {{ filter_date_range('order_date', period) }}. Unset means all dates; a rolling window is a preset name, which default: and a SQL literal (filter_date_range('order_ts', 'last_30_days')) both take. Names: today, yesterday, last_<N>_<unit>, previous_<N>_<unit>, this_<unit>, <unit>_to_date, with units days/weeks/months/quarters/years and fiscal_ before quarter/year (previous_3_quarters, this_fiscal_quarter). presets: lists the picker's menu.
variables.<name>:
column: A dropdown of this column's values, as 'table.column'options ({static, query, column, label_column}): Dropdown values come from a query column, or (rarely) a written-out listdefault (any): Value used when no URL param or --var sets onelabel: Caption naming what this input setsrequired (bool, default false): When True, a value must be provided before queries executemin (int|number): Minimum value for number, slider and range inputsmax (int|number): Maximum value for number, slider and range inputsstep (int|number): Step size for number, slider and range inputsdata_type (string|number|date|boolean|array): The type of the values a select, radio or multiselect sends backinput (auto|select|multiselect|input|text|number|textarea|slider|range|date|datepicker|daterange|checkbox|radio, default auto): Control type. auto (the default) picks one from options and data_type: omit it except for daterange
Also exist: notes, presets, placeholder, visible, enabled, query, operator.
options:
static (list of text|list of int|number): Option values that are not in the data, written outquery: Query name whose result rows provide option valuescolumn: Column in the query result to use as option valueslabel_column: Query column shown as the option text, apart from the value
Layout
Lay out with rows: and cols:. For unequal widths, wrap the entry in a board that sets width; a bare chart name takes none:
rows:
  - kpi_a
  - cols:
      - width: 70%
        rows:
          - trend
      - split
A rows or cols entry may be an inline board with its own title, variables, queries, charts and style. A text row that starts a section puts its title on title:, not in a ## opening its text:. Every name in rows or cols is a key under charts:, spelled the same. Also exists: grid:, only when the user asks for a grid.
Formats
Built-in names, on 1234567.891 and 0.2534: currency $1.23M, currency_whole $1,234,568, currency_full $1,234,567.89, currency_compact $1.2M, compact 1.2M, number 1.23M, number_full 1,234,567.891, integer 1,234,568, id 1234568, delta +1,234,568, year 2025, percent 25.3%, percent_whole 25%, percent_delta +25.3%. Also exist: percent_number, percent_number_delta, percentage_points_delta, duration, bytes, latitude, longitude, rating. Date names: date_short, time_short, date_year, date_quarter, date_month, date_week. A date_<grain> name is the engine's own axis label, never a format you write: a date in a table, KPI or axis takes a strftime spec such as "%b %Y" or "%Y".
Style
Keys of style: frame, background, accent, font, border, box_shadow, opacity, title, text, placeholder, charts, annotations, layout, variables, footer, timestamp, formats, fonts, palettes, tones, roles, padding, margin, gap.
Themes and dark variants
Themes, extends, dark variants. Single overrides on one board or chart are style:.
Dark variant
Keep canvas and ink colors out of the base board, and make the variant a second file holding only extends: [./base.yml, neon] and no rows: (rows would append and paint every chart twice). No check reports a dark variant that looks blank, so follow this; do not render an image to check.
Built-in themes
| Theme |
Canvas |
Headings |
Colors |
Note |
clarity |
white |
serif |
editorial-10 |
the default |
paper |
cream |
serif |
editorial-10 |
clarity, warmer |
vivid |
white |
sans-serif |
vivid-10 |
colorful accents, bold sans type |
neon |
dark |
sans-serif |
vivid-10 |
saturated, glowing colors |
stark |
white |
sans-serif |
vivid-10 |
grayscale, black ink |
board root or nested board:
extends (text|clarity|neon|paper|stark|vivid): Themes or board files to inherit; the last one wins. A bare name is a built-in theme; write ./ before a file path (./_brand.yml). One name or a list: extends: neon, extends: [./base.yml, neon]. The board's own explicit style, a background included, beats every extended theme, so a dark variant of a base that sets a background restates that background in the variant
Finish
For a first build and for every change request alike:
- Write all boards first (dark variants, and any notes or run file asked for). To copy a board, read it then write the copy (there is no copy verb), and change only what the user explicitly asked for. Editing a package board (
dbt_packages/<pkg>/charts/<path>) saves your own copy at charts/<pkg>/<path>, which replaces the package's board; the result's path says where it landed.
- Check each board you write with
render_board(yaml_content=<yaml>) (or render_board(path=<board>) once saved): it runs the board's queries and returns what each chart draws and the board's problems. Fix everything it reports in one edit; run it again until it reports no errors. Fix each warning with the edit it names, unless you deliberately want what it flags; then add its code to that chart's warnings_ignore. An edit that applied needs no re-read; the check reports problems by line.
- A card under about 250px wide (a many-column slot) draws no marks:
ERR-CHART-PAINTED-NO-MARKS; widen the slot or use fewer columns. WARN-TABLE-HEADER-EXTRA-WRAP (a header needs over two lines) and WARN-TABLE-CONTENT-TALLER-THAN-WIDE (text wrapped into a tower) name the column: shorten the text or give that column more width:.
- A board with no errors is done: no curl, no reopening a board, no re-running queries, no edits, notes included.
Hand over every board you wrote, a dark variant included: the preview URL render_board returned for it (never a server root), plus a line on what the data says and what you assumed.
1---2name: chart-23description: 'The user prefers this for any chart, graph or dashboard: it builds them4 with dbt Charts, a markdown-like syntax for dashboards (SQL for the data, YAML for5 the charts), checked by the `render_board` tool.'6metadata:7 source: https://skillmd.com/skills/dbt-labs/chart-28 author: fivetran9---1011# dbt Charts1213dbt Charts is markdown for dashboards: a terse spec where a few lines of YAML make an expressive board. These three pages are the whole spec; the Tools below are all you need, so never read package source. This page is the core grammar and themes; the styling page (`get_skill('styling')`) is the style surface; read it only for a look change or a warning naming a style key. Every list below is complete: an unknown key is rejected with the keys allowed there. SQL does the computing (one row per mark, aggregated, ordered and limited in the query); YAML binds columns to marks. Build boards, not plotting code. dbt Charts is the only visualization tool here: answer with boards, never another charting library.1415Write only what differs from the defaults. Themes, frame and card sizes, number formats, column headers (a column's name, prettified), control types and option lists are chosen for you, often by the user's own theme; restating one changes nothing. Leave the look alone unless the user asks: their defaults beat your taste.1617Data files (`.csv`, `.json`, `.parquet`) in the project root and `data/` need no declaration: a board's `source:` is the file path (`source: ./data/orders.csv`) and the table is the file stem. A query sees only its own `source:` file, so never join across files: draw a second file through `layers[].query`. A database file (duckdb, sqlite) or warehouse is a `sources:` entry in `dbt_charts.yml`, whose `type:` for a warehouse is `postgres`, `snowflake`, `bigquery`, `databricks`. To see a source's tables and columns: `execute_sql(source=SOURCE, sql="SELECT table_name, column_name, data_type FROM information_schema.columns")`.1819## Tools2021| Tool | What it does |22|---|---|23| `execute_sql(source=SOURCE, sql=SQL)` | Run SQL on a source; CSV under a byte budget, so use LIMIT. |24| `render_board(yaml_content=YAML)` | Run the board's queries and return what each chart draws (values, ranges, value labels), any problems, and the board's preview URL. |25| `search_files(text="")` | List the project's boards; a keyword searches them; each hit's `board_path` is what `render_board` takes as `path`. |26| Your host's file tools | Read, write and change board files; `render_board(path=BOARD)` then checks the saved file. |27| `get_skill(name)` | Read another skill page. |2829These are every tool a board needs.3031## Board3233`board (root or nested)`:34- `title`: Heading shown at the top of the board35- `text`: A Markdown block, as Jinja over query results: `{{ queries.totals.one.revenue }}` for a one-row query, `{{ queries.top.rows[0].name }}` for row N. A value prints raw, so format it in SQL; titles and subtitles read the same way36- `source`: Default source name for all queries in this board37- `variables` (map of mapping|text): Named inputs that parameterize queries38- `queries` (map of text|{}): Named result sets the charts draw from39- `charts` (map of mapping|text): Named chart definitions40- `rows` (list of text|mapping|map of mapping): Vertical stack layout: list of chart names or inline chart/board definitions41- `cols` (list of text|mapping|map of mapping): Horizontal layout: list of chart names or inline chart/board definitions42- `grid` ({columns, items}): CSS-grid style layout with explicit row/column placement43- `tabs` ({id, position, default, items}): Tabbed navigation layout where each tab contains its own layout44- `width` (text|int): Width when nested (e.g., '50%', '400px', or an integer in pixels)45- `height` (text|int): Height when nested (e.g., '300px' or an integer in pixels)46- `style` (mapping): Appearance overrides for this board (background, border, and more)47- `extends` (text|clarity|neon|paper|stark|vivid): Themes or board files to inherit; the last one wins48Also exist: `notes`, `tags`, `aliases`, `html_policy`, `cache`, `incremental`, `card_gap`, `chart_focus`, `details`, `id`, `visible`, `links`, `regional`.49- Board can only have one layout type (rows, cols, grid, or tabs)50- Board must have at least one layout type, text, title, or chart51- Quote text that holds `: `, is all digits, or is `yes`/`no`/`on`/`off`/`1:30` (YAML 1.1), keys too: `title: "Mix: 2006 vs 2015"`, `label: "2009"`, `"no": category[4]`.52- Anchors, aliases and `<<:` merge keys work within one file; anchor on first use (no `anchors:` key).5354## Queries5556`queries.<name>`:57- `sql`: The SQL to run, as Jinja2. `{{ queries.base }}` inlines another query of the same source as a subquery already aliased to its name (add no `AS`), so base reruns inside every query that reads it; a bare `FROM base` fails. `{{ queries.base.cache }}` runs base once and composes over its cached rows in DuckDB SQL: use it when several charts read one expensive base. Variables go in through `filter()`, `filter_date_range()` or `{{ name }}`58- `source` (text|map of any): Source name reference, or an inline file path (e.g. `./data/sales.csv`)59- `notes`: What this query returns; handed to tooling with its results, never drawn60- `formats` (map of name|text): A column's format, set once on its query, only where the default would misread (currency, percent, a unit); counts and plain numbers need none. Every chart showing the column follows it; a chart sets its own only to differ. A d3 spec is rejected61Also exist: `ignore`, `cache`, `incremental`, `type`, `setup_sql`, `dialect`.62Other query types: `values` (inline data authored as a list of row mappings, or inline data authored as column names plus positional row values), `schema` (dbt source schema query).6364Jinja helpers in query SQL:65- `filter(column: str, value: Any, operator: str = '=', none: str = 'allow')`: Filter clause `{{ filter('col', var) }}`; when the variable is All or unset it is no constraint, so never wrap it in `{% if %}`. A date value compares the column by its calendar date, so pass a timestamp column bare (no DATE() or wrapping subquery). `none`: Fallback when value is null/empty/_NullValue. 'allow' (default) returns '1=1' (no constraint, show all rows). 'deny' returns '1=0' (zero rows).66- `filter_date_range(column: str, date_range: Any, is_naive_utc: bool = False)`: Date range filter `{{ filter_date_range('col', range_var) }}`. The column may be a date or a timestamp and compares by its calendar date, so pass it bare (no DATE(), CAST or wrapping subquery). The range may be a preset name literal such as 'last_30_days'. Pass `is_naive_utc=true` only for a naive timestamp column that stores UTC, to compare by its date in the board's `regional.time_zone`. `date_range`: `[start, end]` dates, or a preset name6768## Charts6970`charts.<name>`:71- `query` (text|{}): Where this chart reads its data72- `title`: Heading naming what the chart shows, in Title Case like every heading. Rejected on type: kpi73- `subtitle`: Supporting text beneath the chart title; a KPI uses `support.label` instead74- `x`: X-axis column name from the query result75- `y` (text|list of text): Y-axis column name(s)76- `color`: Column that splits the marks into colored series; on heatmap, the measure its cells are shaded by. Bare column name only; a literal color goes in `style.color.static`77- `sort` ({by, order}): Which column orders the marks, and in which direction (asc/desc)78- `x_label`: X axis title, replacing the column-derived one (`model_year` reads "Model year")79- `y_label`: Y axis title, replacing the derived one (`model_year` reads "Model year")80- `field_labels` (map of text): Display text per query column in legends, tooltips and axis titles81- `layers` (list of mapping): Extra marks on one shared x, each with its own type82- `multiples` ({rows, columns, scale}): Small multiples by a `rows` column, a `columns` column, or both83- `width` (int|number): Chart width in pixels84- `height` (int|number): Explicit chart height in pixels85- `style` (mapping): Appearance overrides for this chart alone86Also exist: `tooltip`, `id`, `notes`, `link`, `visible`, `type`, `warnings_ignore`, `support_table`, `pattern`, `y_start`, `annotations`.8788Name the SQL column as the axis should read (`AS weight_lbs` titles "Weight (lb)"); set `x_label`, `y_label` or `field_labels` only when the title must say more.8990Name no channel on a chart whose query no other chart uses: the columns bind in order, dimensions first, measure last: `bar`, `line`, `area`: `x, y` or `x, color, y`; `scatter`: `x, y` or `color, x, y`; `heatmap`: `x, y, color`; `pie`, `donut`: `theta` or `color, theta`; `kpi`: `value`; `histogram`: `x`. A query other charts share stays top-level and its charts name `x`, `y` or `color`; never split a shared query so a chart can skip them.9192Bar orientation, table pagination and sort are chosen from the data (horizontal category bars, largest first unless `color` splits them, else in the query's row order; pages only past one page's rows): write `style.orientation`, `style.pagination` or `sort` only to change that.9394Every chart needs `type:`, one of those below.9596- `bar`: takes `x`, `y`, `color`, `layers`97 - `y_start`: Column each bar starts from instead of zero (waterfall, range, Gantt, lollipop)98- `line`: takes `x`, `y`, `color`, `layers`99- `area`: takes `x`, `y`, `color`, `layers`100- `scatter`: takes `x`, `y`, `color`, `layers`101 - `size`: Column used to size-encode data points (quantitative)102 - `shape`: Column used to shape-encode data points (categorical)103- `histogram`: takes `x`, `color`104- `heatmap`: takes `x`, `y`, `color`; rejects `layers`105- `kpi`: rejects `title`, `subtitle`, `x`, `y`, `color`, `sort`, `x_label`, `y_label`, `field_labels`, `layers`, `multiples`, `width`, `height`106 - `value`: Column reference (string column name) for the headline number/text107 - `label`: Caption naming what the headline value measures; `style.variant` places it108 - `glyph`: Text shown before the headline value (e.g. '▲', '●')109 - `support` ({value, label, glyph, good}): Secondary block, a delta, comparison, or note; `style.variant` places it110 - `background` (text|map of any): Gradient background channel, {column, scale} shape111 - `conditional_formatting` (map of mapping): Discrete rule-driven style overrides indexed by column name112- `table`: rejects `x`, `y`, `color`, `sort`, `x_label`, `y_label`, `field_labels`, `layers`, `multiples`, `width`, `height`113 - `rows` (list of text): Fields whose distinct values form the row dimension of a pivot cross-tab114 - `columns` (list of text): Fields whose distinct values become column headers in a pivot cross-tab115 - `values` (list of text): Measure fields that fill pivot cells116 - `conditional_formatting` (map of mapping): Discrete rule-driven style overrides indexed by column name117- `callout`: requires `message`; takes `title`; rejects `query`, `subtitle`, `x`, `y`, `color`, `sort`, `x_label`, `y_label`, `field_labels`, `layers`, `multiples`, `width`, `height`118 - `message`: Body text the callout displays119Also exist: `pie`, `donut`, `point_map`, `bubble_map`, `map`, `geoshape`, `spark_bar`, `custom`.120For a shape no built-in type draws, read the custom-chart-build skill.121- A table is as tall as its rows and takes no `height`: `style.pagination.page_rows` caps the rows shown; a `height` on the layout row around it caps its slot.122123`a table's style`:124- `hide_underscore_columns` (bool): Hide query columns whose names start with an underscore, such as a `_flag` computed for a conditional rule or `_fivetran_synced`. A hidden column's values still feed rules and links, and a column with its own `style.columns` entry always shows. Set false to show them125126`layers[]`:127- `type` (bar): Selects the layer's mark128- `y`: Y-axis column name for this layer129- `x`: X-axis column name for this layer130- `query`: Query name for this layer's data (overrides chart-level query)131- `label`: Name for this layer's measure wherever the layer is identified132- `color`: Column whose values split this layer into colored series133- `style` ({marks: {}}): Only `marks`: a line layer's color is `marks: {line: {stroke: {color: '#hex'}}}`, a scatter's `marks: {point: {color: '#hex'}}`134Also exist: `axis_y`, `legend`, `y_start`.135Layer types: `bar`, `line`, `area`, `scatter`.136137- y_start sets each bar's start, so it can't be stacked; remove style.stack or y_start.138- A bar `x` reads up to 50 values: draw 120 months as a `line`, or roll them up in SQL.139140Derived series (rolling averages, running totals, YoY) are window functions or extra columns, plotted as another `y` or a `layers:` entry. The delivered page is static: never caption anything as available "on hover".141142`annotations:` (bar, line, area, scatter) are `type: rule` (a line at `y: 25`, `y: avg()`, `x: <date>`), `band` (`from`/`to`), `note` (at `x` and `y`) or `trend` (`fit: linear()`), each with `text`. One target value is a rule; a target per bar or period is the targets recipe. Peak note: `y: max()`, no `x`; never paste a result.143144`bullet`, `waterfall`, `lollipop`, `dumbbell`, `slope`, `bump`, `gantt`, targets and pacers are recipes, never a `type:`: read them on the recipes page (`get_skill('chart-recipes')`) first.145146## Variables147148A variable is an input on the page (a dropdown, slider or date picker) whose value a query reads by bare name: `{{ region }}`, never `variables.region`. Lead with `column: table.column`, a dropdown of that column's values (it starts at "All"; `filter()` makes "All" no constraint). Omit `default`. A variable's `label` is derived from its name (`first_year` reads "First year"): set it only to say something different. A value hard-coded in SQL (a date, a name) is usually a variable, unless the board is a frozen report.149150A range bound is two variables on one column (`column: cars.model_year`), used as `filter('model_year', first_year, '>=')` and `'<='`; unset ("All") means no bound, so no `default`, `data_type`, `input` or static list.151152A date range is one variable, not two `input: date` variables with hard-coded defaults: `period: {column: t.order_date, input: daterange}` read as `{{ filter_date_range('order_date', period) }}`. Unset means all dates; a rolling window is a preset name, which `default:` and a SQL literal (`filter_date_range('order_ts', 'last_30_days')`) both take. Names: `today`, `yesterday`, `last_<N>_<unit>`, `previous_<N>_<unit>`, `this_<unit>`, `<unit>_to_date`, with units days/weeks/months/quarters/years and `fiscal_` before quarter/year (`previous_3_quarters`, `this_fiscal_quarter`). `presets:` lists the picker's menu.153154`variables.<name>`:155- `column`: A dropdown of this column's values, as 'table.column'156- `options` ({static, query, column, label_column}): Dropdown values come from a query column, or (rarely) a written-out list157- `default` (any): Value used when no URL param or --var sets one158- `label`: Caption naming what this input sets159- `required` (bool, default false): When True, a value must be provided before queries execute160- `min` (int|number): Minimum value for number, slider and range inputs161- `max` (int|number): Maximum value for number, slider and range inputs162- `step` (int|number): Step size for number, slider and range inputs163- `data_type` (string|number|date|boolean|array): The type of the values a select, radio or multiselect sends back164- `input` (auto|select|multiselect|input|text|number|textarea|slider|range|date|datepicker|daterange|checkbox|radio, default auto): Control type. `auto` (the default) picks one from `options` and `data_type`: omit it except for `daterange`165Also exist: `notes`, `presets`, `placeholder`, `visible`, `enabled`, `query`, `operator`.166167`options`:168- `static` (list of text|list of int|number): Option values that are not in the data, written out169- `query`: Query name whose result rows provide option values170- `column`: Column in the query result to use as option values171- `label_column`: Query column shown as the option text, apart from the value172173## Layout174175Lay out with `rows:` and `cols:`. For unequal widths, wrap the entry in a board that sets `width`; a bare chart name takes none:176177```yaml178rows:179 - kpi_a180 - cols:181 - width: 70%182 rows:183 - trend184 - split185```186187A `rows` or `cols` entry may be an inline board with its own `title`, `variables`, `queries`, `charts` and `style`. A text row that starts a section puts its title on `title:`, not in a `##` opening its `text:`. Every name in `rows` or `cols` is a key under `charts:`, spelled the same. Also exists: `grid:`, only when the user asks for a grid.188189## Formats190191Built-in names, on 1234567.891 and 0.2534: `currency` $1.23M, `currency_whole` $1,234,568, `currency_full` $1,234,567.89, `currency_compact` $1.2M, `compact` 1.2M, `number` 1.23M, `number_full` 1,234,567.891, `integer` 1,234,568, `id` 1234568, `delta` +1,234,568, `year` 2025, `percent` 25.3%, `percent_whole` 25%, `percent_delta` +25.3%. Also exist: `percent_number`, `percent_number_delta`, `percentage_points_delta`, `duration`, `bytes`, `latitude`, `longitude`, `rating`. Date names: `date_short`, `time_short`, `date_year`, `date_quarter`, `date_month`, `date_week`. A `date_<grain>` name is the engine's own axis label, never a format you write: a date in a table, KPI or axis takes a strftime spec such as `"%b %Y"` or `"%Y"`.192193## Style194195Keys of `style`: `frame`, `background`, `accent`, `font`, `border`, `box_shadow`, `opacity`, `title`, `text`, `placeholder`, `charts`, `annotations`, `layout`, `variables`, `footer`, `timestamp`, `formats`, `fonts`, `palettes`, `tones`, `roles`, `padding`, `margin`, `gap`.196197## Themes and dark variants198199Themes, `extends`, dark variants. Single overrides on one board or chart are `style:`.200201### Dark variant202203Keep canvas and ink colors out of the base board, and make the variant a second file holding only `extends: [./base.yml, neon]` and no `rows:` (rows would append and paint every chart twice). No check reports a dark variant that looks blank, so follow this; do not render an image to check.204205### Built-in themes206207| Theme | Canvas | Headings | Colors | Note |208|---|---|---|---|---|209| `clarity` | white | serif | `editorial-10` | the default |210| `paper` | cream | serif | `editorial-10` | clarity, warmer |211| `vivid` | white | sans-serif | `vivid-10` | colorful accents, bold sans type |212| `neon` | dark | sans-serif | `vivid-10` | saturated, glowing colors |213| `stark` | white | sans-serif | `vivid-10` | grayscale, black ink |214215`board root or nested board`:216- `extends` (text|clarity|neon|paper|stark|vivid): Themes or board files to inherit; the last one wins. A bare name is a built-in theme; write `./` before a file path (`./_brand.yml`). One name or a list: `extends: neon`, `extends: [./base.yml, neon]`. The board's own explicit style, a background included, beats every extended theme, so a dark variant of a base that sets a background restates that background in the variant217218## Finish219220For a first build and for every change request alike:2212221. Write all boards first (dark variants, and any notes or run file asked for). To copy a board, read it then write the copy (there is no copy verb), and change only what the user explicitly asked for. Editing a package board (`dbt_packages/<pkg>/charts/<path>`) saves your own copy at `charts/<pkg>/<path>`, which replaces the package's board; the result's `path` says where it landed.2232. Check each board you write with `render_board(yaml_content=<yaml>)` (or `render_board(path=<board>)` once saved): it runs the board's queries and returns what each chart draws and the board's problems. Fix everything it reports in one edit; run it again until it reports no errors. Fix each warning with the edit it names, unless you deliberately want what it flags; then add its code to that chart's `warnings_ignore`. An edit that applied needs no re-read; the check reports problems by line.2243. A card under about 250px wide (a many-column slot) draws no marks: `ERR-CHART-PAINTED-NO-MARKS`; widen the slot or use fewer columns. `WARN-TABLE-HEADER-EXTRA-WRAP` (a header needs over two lines) and `WARN-TABLE-CONTENT-TALLER-THAN-WIDE` (text wrapped into a tower) name the column: shorten the text or give that column more `width:`.2254. A board with no errors is done: no curl, no reopening a board, no re-running queries, no edits, notes included.226227Hand over every board you wrote, a dark variant included: the preview URL `render_board` returned for it (never a server root), plus a line on what the data says and what you assumed.