
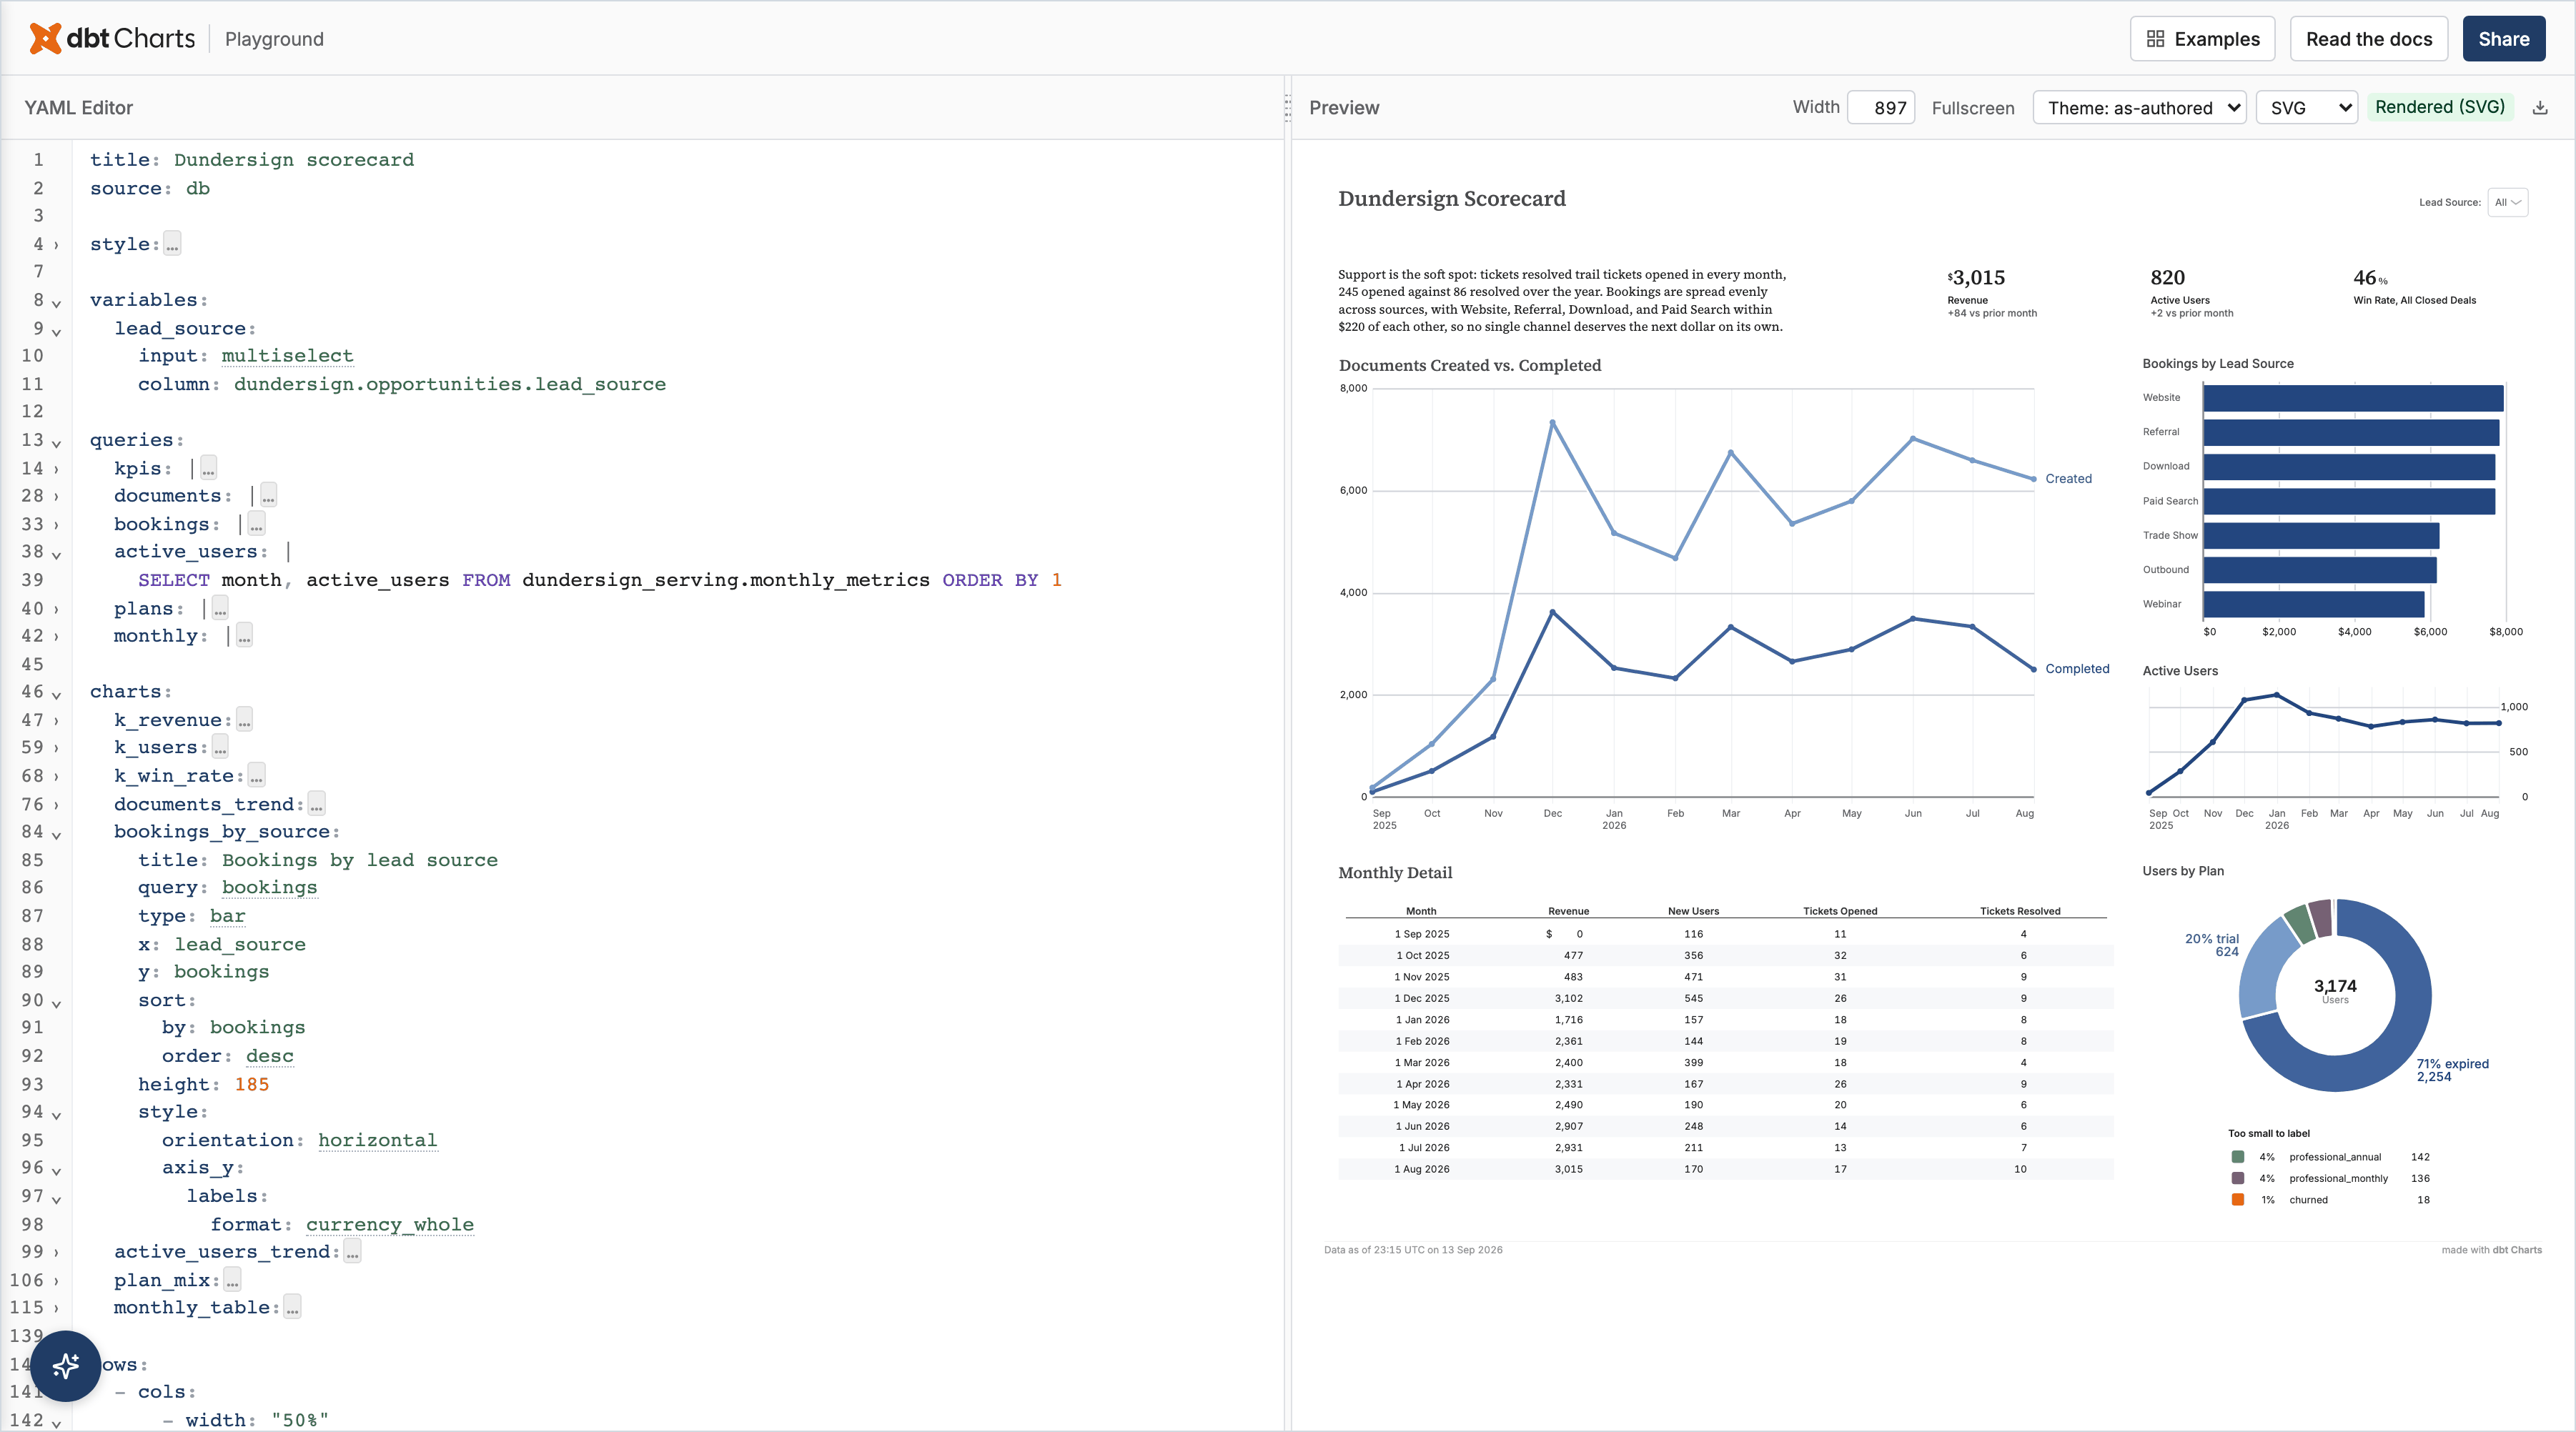
Report Design
Reports are narrative-driven documents that tell a story with data and answer specific questions. They are NOT dashboards.
Implementing in YAML? Switch to
get_skill('chart')for the build-test-iterate workflow.
Report vs. Dashboard
| Report | Dashboard | |
|---|---|---|
| Purpose | Answer a question, tell a story | Monitor status at a glance |
| Text | Extensive — narrative + recommendations | Minimal — titles and labels |
| Charts | Support the narrative (3-6 typically) | ARE the content |
| Structure | Executive summary → analysis → conclusions | KPIs → trends → breakdowns |
| Interaction | Read in minutes | Scan in seconds |
If the user needs at-a-glance monitoring, use the chart skill instead.
Core Principles
- Answer the question first — lead with the conclusion, not the methodology
- Every chart serves the narrative — no chart without explanatory text above it
- Tell a story — setting (context) → conflict (problem/question) → resolution (findings + recommendations)
- Be specific — "Revenue dropped 12% because Region X lost 3 key accounts" not "Revenue decreased"
- Professional tone — direct, concise, active voice
Narrative Structure
Every report follows this arc:
1. EXECUTIVE SUMMARY
   - 2-3 sentences with key findings
   - Recommendation in bold
   - The answer, upfront

2. CONTEXT
   - Time period, scope, data sources
   - Why this analysis was needed

3. ANALYSIS SECTIONS (2-4)
   - Each section: one finding
   - Pattern: State finding → explain significance → show chart evidence
   - Transition between sections

4. CONCLUSIONS & RECOMMENDATIONS
   - Numbered, specific, actionable (who/what/when)
   - Quantify expected impact when possible
Chart Selection for Reports
Reports use fewer charts than dashboards. Each must be referenced in the narrative:
| Report Need | Chart Type | Example Narrative |
|---|---|---|
| The trend that tells the story | line |
"Revenue has been declining since March" |
| Segments that matter | bar |
"Region X underperformed by 23%" |
| A key metric | kpi |
"Total impact: $2.3M" |
| Detailed breakdown | table |
"Here are the top 10 affected accounts" |
| Composition change | area (stacked) |
"The product mix shifted toward lower-margin items" |
Prefer: Fewer charts with more text. Tables for evidence. KPIs for anchoring key numbers.
Avoid: Many KPIs in a row (dashboard pattern). Charts without narrative context. Interactive filters (reports present a specific analysis).
Writing Content
Use text: blocks in YAML for narrative text (Markdown). Never put one text: row
right after another; continue the Markdown in the same block.
Opening each section:
- State the finding first
- Explain why it matters
- Introduce the chart
Closing each section:
- Summarize the implication
- Transition to the next section
Tone guidelines:
- Active voice: "Revenue declined" not "A decline was observed"
- Specific numbers: "12% decline" not "significant decrease"
- No filler: Cut "It's worth noting that..." — just note it
- Honest about uncertainty where data doesn't fully support a claim
YAML Structure for Reports
Reports use heavier text: usage than dashboards:
title: "Q3 Revenue Analysis"
source: warehouse

queries:
  revenue_trend:
    sql: SELECT month, revenue FROM monthly_revenue ORDER BY month

charts:
  trend:
    query: revenue_trend
    type: line
    x: month
    y: revenue

rows:
  - title: Executive Summary
    text: |
      Q3 revenue declined 12% quarter-over-quarter, driven primarily
      by the loss of three enterprise accounts in the West region.
      **Recommendation: Prioritize retention program for accounts >$100K ARR.**

  - title: Revenue Trend
    text: |
      Monthly revenue peaked in June and has declined each month since.
  - trend

  - title: Conclusions
    text: |
      1. Launch retention program for enterprise accounts by end of month
      2. Investigate West region account manager capacity
Key differences from dashboard YAML:
- Heavy
text:blocks with narrative - A new section is a row with its own
title:, not a##opening itstext:; text that isn't a new section stays in the block above - Fewer charts (3-6), more text
- No
variables:— reports present a specific analysis - Top-level flow follows the narrative arc
Quality Checklist
- Answers the question in the executive summary
- Executive summary comes first (conclusion before methodology)
- Every chart has narrative context above it
- Findings are specific (numbers, percentages, comparisons)
- Recommendations are actionable (who/what/when)
- Story flows logically section to section
- Appropriate length (3-6 analysis sections)
- Professional tone (direct, specific, active voice)
Common Mistakes
| Mistake | Fix |
|---|---|
| Methodology before conclusions | Lead with the answer — executives read top-down |
| Chart without narrative context | Every chart needs explanatory text above it |
| Vague findings ("revenue decreased") | Be specific: "revenue declined 12% QoQ" |
| Dashboard patterns in a report (KPI row) | Reports use narrative flow, not monitoring layout |
| Too many charts | 3-6 max — each must serve the story |
| Hedging without reason | Be confident where data supports it |
Rationalizations to Resist
| Excuse | Reality |
|---|---|
| "User wants the methodology first" | They don't. They want the answer. Methodology can follow. |
| "Adding more charts shows thoroughness" | It shows clutter. Every chart must serve the narrative. |
| "I'll add filters so they can explore" | That's a dashboard. Reports present a specific analysis. |
| "The data speaks for itself" | It never does. Interpret it — that's the report's job. |