
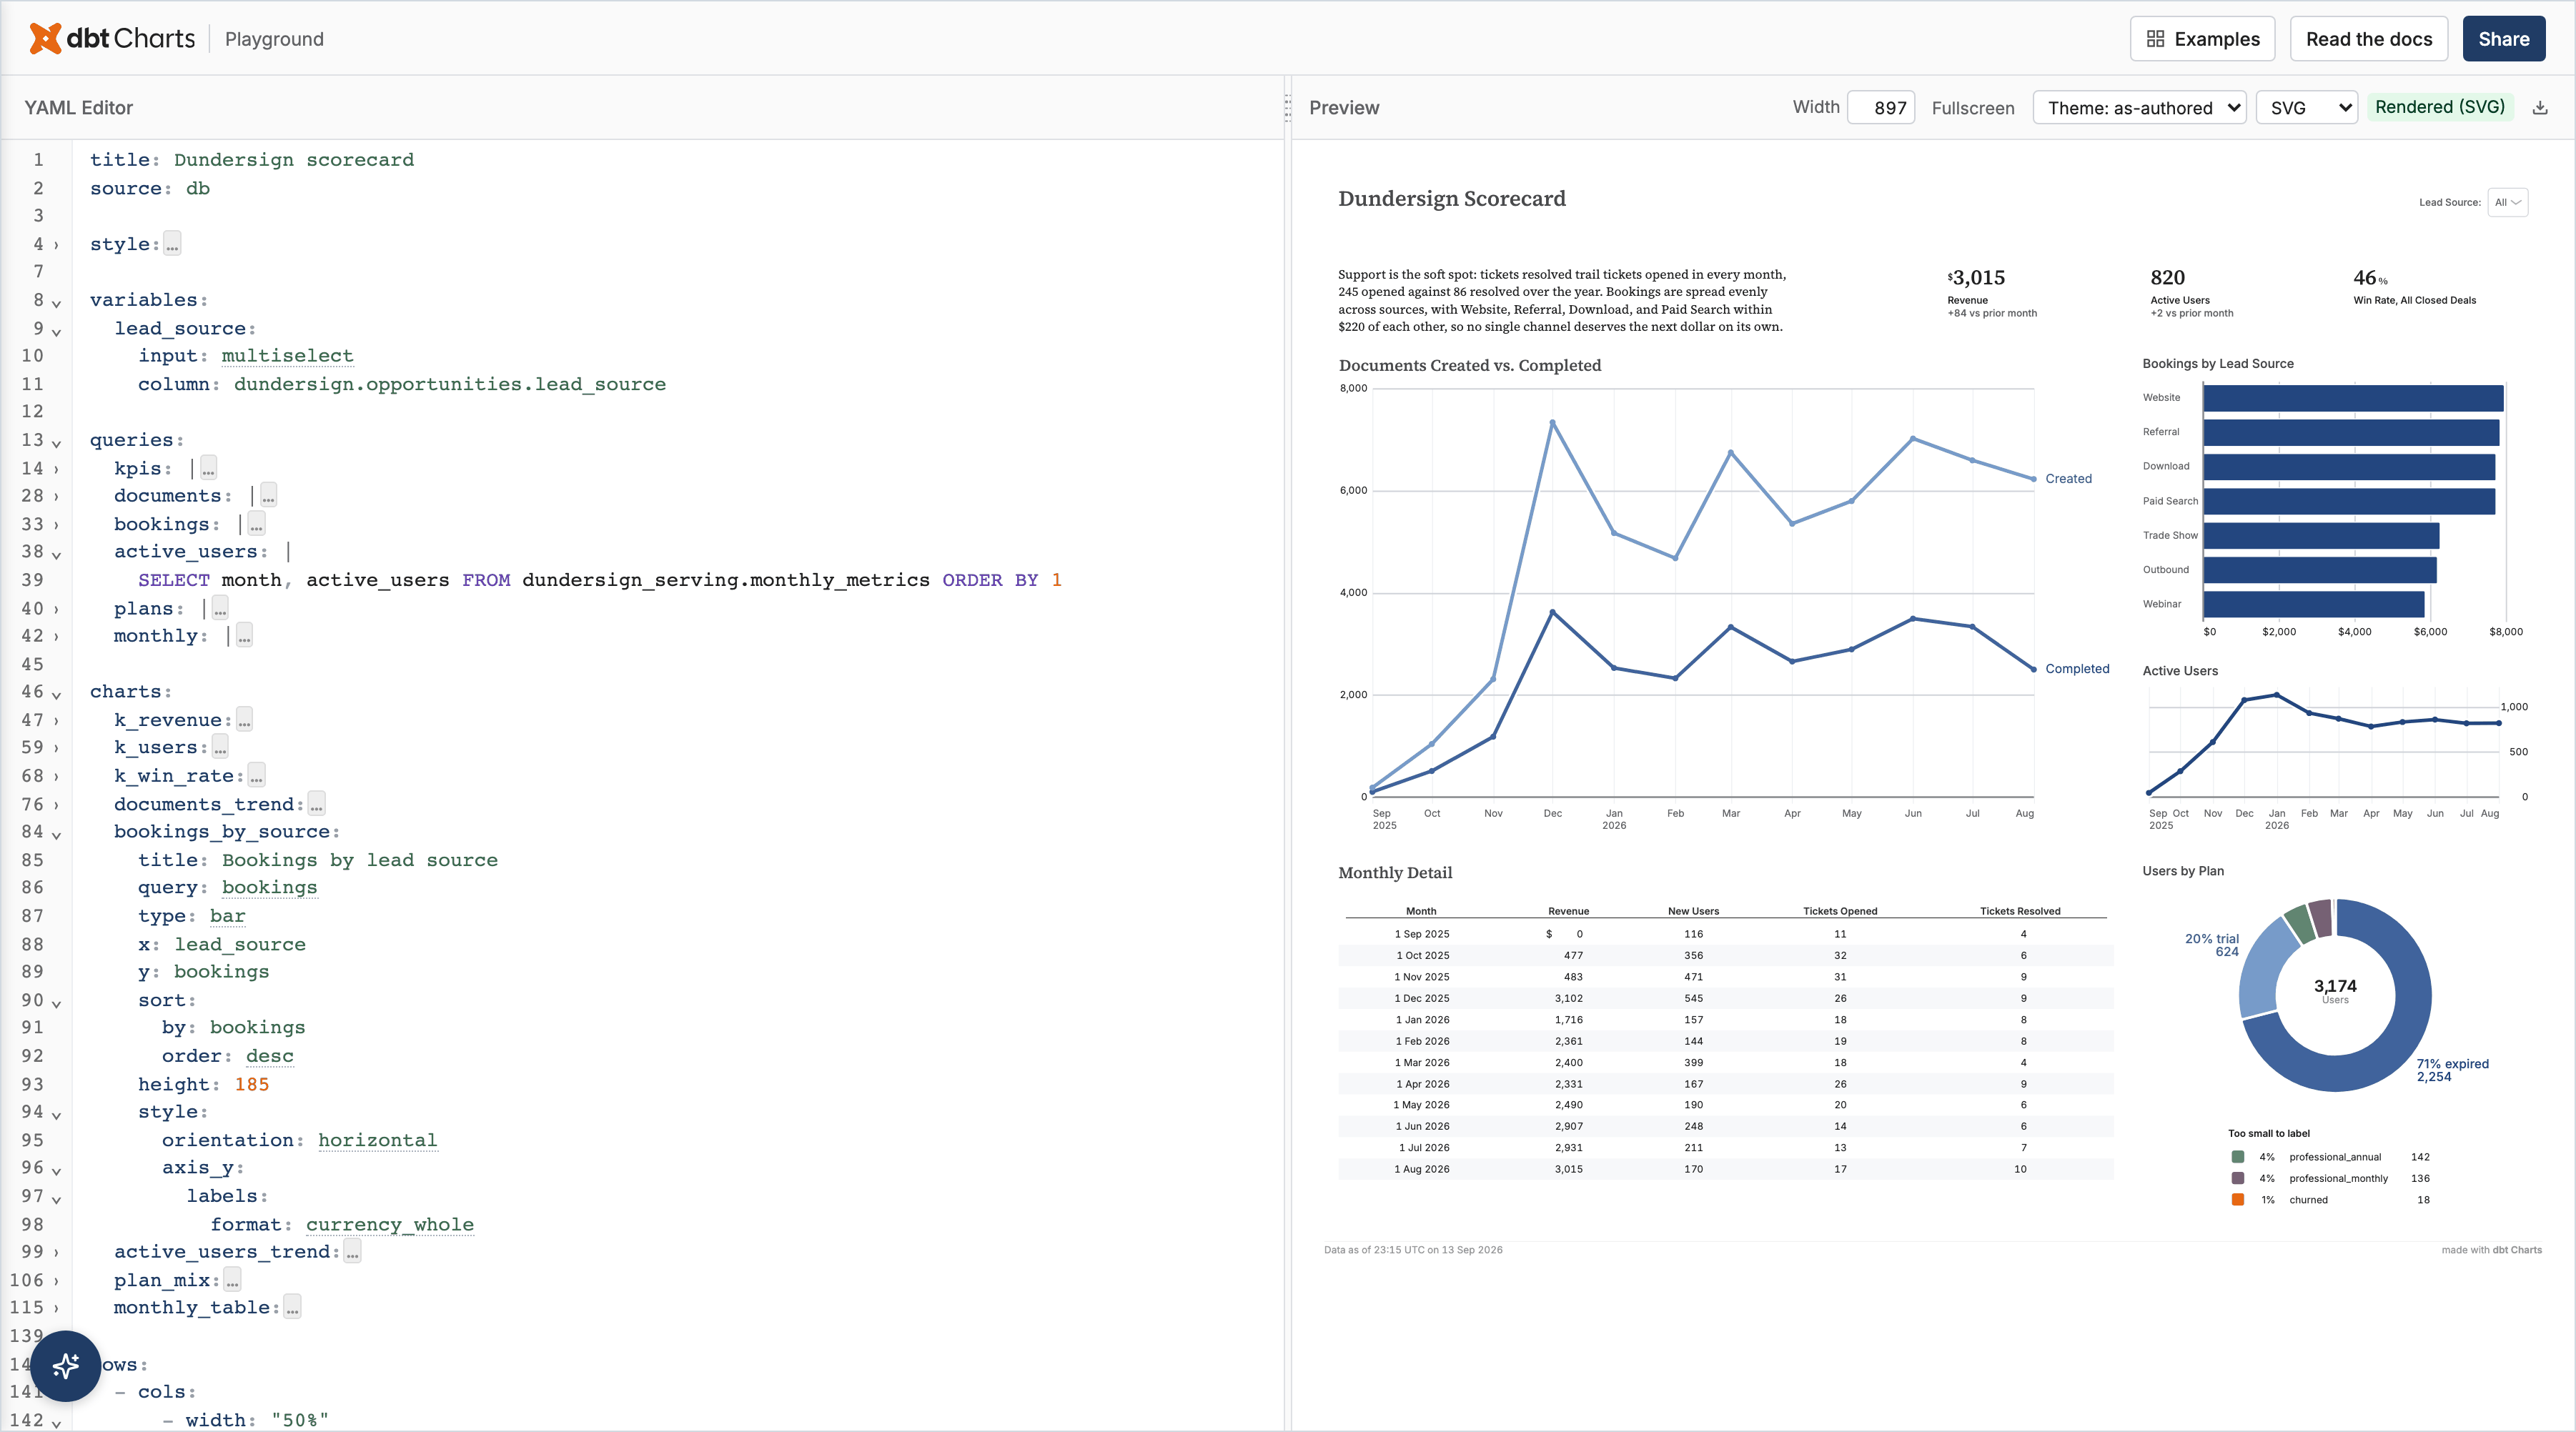
Styling
There are two groups of visual objects, boards and charts (a table or KPI is a chart type), and each has a style:. These are its options; the lists are complete and an unknown key is rejected with the keys allowed there. style: goes on a board, a nested board, a chart and charts/meta.yml, and merges low to high: theme, extends, the board's style, a nested board's, style.charts, style.charts.<type>, a chart's own; an explicit key beats any theme. Inside one chart's style: write its family's keys directly (charts.<c>.style.orientation), never under bar: or table: as in style.charts.bar.
For no border, omit border; border: none is rejected.
Board
style:
background: Working-surface background color (board and card fills)accent: Accent color token cascaded to focus ringsfont(mapping): Root font: literal family, size, weight, color; never afontsnamefonts(map of mapping): Named fonts as<name>: {family, size, weight, color}, never a bare family string; other font slots reference one asfont: <name>orfont: {extends: <name>, ...}.headingcarries the H1–H6 ramp insizesandsectionthe H2–H6 section-title sizes. Any other entry no slot references paints nothingformats(map of text|{spec, prefix, suffix, notation, sign_placement, repeat}): Format alias map; None means no aliases at this cascade levelpalettes(map of name): Theme palette role assignments: role name to a built-in palette name, never a color. Custom colors go incharts.color.categorical.palette: [hex, ...]. Default seed: chrome, info, negative, positive, warning, category, sequence, divergeborder(text|{radius, color, width, dash_array, line_cap, dash_offset}): Frame drawn around the whole board:{width, color, radius}or'2px solid #333'. Omit the key for no borderframe({max_width, min_height, margin, card_padding, card_gap}): Board-level structural frame dimensionstitle(mapping): Typography for every headingtext(mapping): Markdown and plain text content stylefooter(mapping): Page footer chrome visibilitycharts(mapping): Root of all chart-type styles and shared chart configuration Also exist:box_shadow,opacity,placeholder,annotations,layout,variables,timestamp,tones,roles,padding,margin,gap.
style.frame:
max_width(number): Widest a board without an exact width may grow, in pixelsmargin(number): Board outer margin in pixelscard_padding(number): Padding added to each card side in pixelscard_gap(number): Gap between cards in pixels Also exist:min_height.
style.font:
family: Font family or CSS stack; single-quote multiword names: "'Source Serif 4', serif"size(number): Font size in pixelsweight(text|number): How heavy the type is drawn (e.g., 'bold', 400, 700)color: Text color as a CSS color string Also exist:style,decoration,case,line_height,emoji.
style.fonts.<name>:
family: Font family or CSS stack; single-quote multiword names: "'Source Serif 4', serif"size(number): Font size in pixelsweight(text|number): How heavy the type is drawn (e.g., 'bold', 400, 700)color: Text color as a CSS color string Also exist:extends,style,decoration,case,line_height,sizes.
style.footer:
visible(bool): Show the footer attribution linetext: Attribution text shown in the footerdivider({visible, color, width, dasharray, gap}): Hairline above the footer text Also exist:link,font,y_offset,brand_weight.
style.formats.<name>:
spec: D3 format string (,.0f;.2swrites 1.2M), preset name (e.g., 'currency'), or Excel pattern. A format is this string alone, or a mapping withspec. A date also takes strftime (%b '%y)prefix: Text placed before the formatted value (e.g., '$')suffix: Text placed after the formatted value (e.g., ' USD', '%')notation(analytic|narrative): Notation style: 'analytic' for SI-prefix (1B, 1M) or 'narrative' for prose-style (1bn, 1m) Also exist:sign_placement,repeat.
style.variables: visible, position, title_inline_band_bottom_pad, gap, label_position, title_inline_title_max_width, font, label, value, placeholder, container_height, border, control_gap, input, presets.
Charts
style.charts (all charts; style.charts.<type> for one type):
tooltip(mapping): Board-wide chart tooltip stylecategory_colors(map of mapping): Board-wide category colors as<column>: {values: {<value>: color}}. Pins a category to one swatch across every chart on the boardborder(text|{radius, color, width, dash_array, line_cap, dash_offset}): Border around every chart card:{width, color, radius}or'1px solid #ccc'. Omit the key for no border; callout cards keep their owndefault_chart_height(number): Fallback chart height in pixels when aspect-ratio sizing is unavailabledefault_table_height(number): Placeholder table height in pixelsmarks(mapping): Global mark defaults (tier-1 of the marks cascade)font(mapping): Chart-level font overrides Also exist:legend,preferred_width,padding,background,aspect_ratio,min_height,max_height,color,title,hover_emphasis,dashes,label_usable_ratio,axis,axis_x,axis_y,axis_quantitative,axis_band,view,bar,line,area,scatter,histogram,heatmap,geoshape,point_map,pie,donut,series_label,kpi,table,spark_bar,support_table,callout.
style.charts.bar, a bar chart's style:
background: Chart-local background color override; None inherits from themepadding({left, right, top, bottom}): Padding as {top, right, bottom, left} in pixels, never one numberaspect_ratio(number): Chart aspect ratio (width/height)color({static, gradient: {}, categorical: {}}): Chart color: static mark paint, categorical palette, and/or gradient scaleaxis_x(mapping): The category or time axis, in either orientation (a horizontal bar's category axis is stillaxis_x). Inherits the global axis_xaxis_y(mapping): The measure axis, in either orientation: its number format goes here, a horizontal bar's too. Inherits the global axis_ylegend(mapping): Chart legend stylemarks({bar: {}, text: {}}): Bar-family mark overridesstack(none|zero|normalize|center): Default stack mode for bar charts; none renders side-by-side columnsorientation(horizontal|vertical|auto): Preferred bar orientationendpoint_labels({label_offset, height}): Styling of the series names printed on stacked bars (legend.position.edge: endpoints) Also exist:annotations,axis_quantitative,title,preferred_width,min_height,max_height,axis,axis_band,support_table,overlap,stack_order,grouped,pattern.
Axes
axis_x:
type(auto|ordinal|temporal): Scale type for bucketed-time x-axes; None/'auto' infers from time_unit graintime_unit(auto|year|yearquarter|yearmonth|yearweek|yearmonthdate|monthofyear|dayofweek|dayofmonth|dayofyear|hourofday|none): Time-unit bucketing for temporal x-axes; None or 'auto' auto-detects from data Also exist:grid,line,ticks,labels,title,scale,position,fill,fiscal_year_start_month.
axis_x.grid, axis_y.grid: visible, opacity, width, color, dash, threshold, torn_baseline.
axis_x.ticks: visible, color, length, width, offset, count, step, time_unit.
axis_x.labels, axis_y.labels: font, padding, max_width, angle, align, overlap, min_gap, visible, expr, bound, flush, offset, format, time_unit, clock, tilt_increments, values.
axis_x.title: font, padding, angle, align, visible.
axis_y.scale:
values(list of any): Explicit tick values; None uses Vega-Lite's auto tick valuesnice(bool): Round the axis domain to nice values; None uses Vega-Lite's defaultheadroom(number): Fractional breathing room at measure-axis edges, exact (never nice-rounded) Also exist:round,clamp,padding,continuous.
axis_y.scale.continuous:
type(linear|log|pow|sqrt|symlog|temporal): Scale type override; a bar rejects 'log', so use 'symlog'domain(tuple[int | float | str, int | float | str]): Explicit [low, high] scale domain; None lets Vega-Lite auto-determine from datazero(bool|auto): Force scale zero-baseline Also exist:log,pow,symlog.
Marks
marks.bar:
band_width(number): Bar width as a fraction of the band step (0 to 1)border(text|{radius, color, width, dash_array, line_cap, dash_offset}): Bar border style (color/width also serve as the bar stroke)labels(mapping): Value label style for bar markstotal_label({visible, format, dx, dy, font: {}}): Stack total label style Also exist:padding,size,gap,min_size,max_size,opacity.
marks.bar.labels:
visible(bool|last): Show numeric value labels on every mark or on listed anchorsformat(name|text|{spec, prefix, suffix, notation, sign_placement, repeat}): Value label format: a name or d3 spec. Without one it takes the axis format, also whenfieldnames another columnposition(above|top|middle|middle_aligned|bottom): Label position:above(past the bar's end, outside),top(inside the end),middle,middle_aligned(all at one height),bottom(inside the start)field: Column whose text labels each mark;''where unlabeled, never NULL. Default: the y column Also exist:dx,dy,font,stacked.
marks.line:
stroke({color, width, cap, join, dasharray}): Line stroke stylecurve(linear|monotone|natural|basis|cardinal|step|step-before|step-after): Line interpolation curve, one of a fixed setlabels(mapping): Value label style for line marks Also exist:connect,disconnected_cap,disconnected_width,halo_multiplier.
marks.point: size, color, shape, opacity, filled, fill, stroke_width, labels.
marks.area: opacity, curve, backdrop, stacked.
Legend and color
legend:
visible(bool|auto): Show the legendposition({align, overlay, edge}): Legend edge (orendpoints), align along it, overlay or reservevalues(list of text): Explicit legend entry order/filter Also exist:direction,columns,compact_columns,row,label,title,symbol_limit,symbol_shape,symbol_fill.
color:
static: One color for all marks: a hex, CSS name,rgb()/oklch()or theme token (category[1],positive.solid,dbt-grays.8). A token follows the theme, a hex stays putcategorical({palette, single_series_palette}): Palettes used when color encodes distinct categories, or a lone seriesgradient(mapping): Continuous gradient scale for the color encoding
color.categorical:
palette(name|list of text|text): Palette name, or a list of colors, even one: ['#2E6B4F']single_series_palette(name|list of text|text): Ink without a color column: palette name, or colors list, even one: ['#2E6B4F']
color.gradient: palette, domain, min, max, nice, null_color, hinge, arm_mode.
Palettes
A palette is named, never spelled as colors.
- Categorical, with how many colors each holds (more categories on one chart than that is
ERR-CATEGORY-COLOR-PALETTE-EXHAUSTED):category-6-tonal-blue(6),category-6-tonal-brown(6),category-6-tonal-green(6),category-6-tonal-orange(6),category-6-tonal-purple(6),editorial-10(10),hero-6(6),tableau(10),vivid-10(10). - Sequential:
dbt-seq-amber,dbt-seq-blue,dbt-seq-brown,dbt-seq-gray,dbt-seq-green,dbt-seq-purple,dbt-seq-rust,dbt-seq-teal(each also as<name>-dark). - Diverging:
dbt-div-blue-red,dbt-div-coolwarm,dbt-div-crimson-green,dbt-div-orange-teal,dbt-div-sunset(each also as<name>-dark). - Tones:
info,negative,positive,warning. - Scaffolds
dbt-creams,dbt-grays, addressed by step number from lightest to darkest (dbt-grays.8, orchrome[8]to follow the theme's scaffold); stops ofdbt-grays:0,1-12,100.whiteandblackname the endpoints.
A color request ("make Created orange") pins category.<hue> under style.charts.category_colors, never a raw hex. If the palette lacks the hue, say so and name the nearest alias it does have.
KPI
a kpi's style:
variant(stacked|inline|compact): Card layoutalign(left|center|right): Horizontal alignment of the value, label, and support text within the cardvalue({font: {}, format, compact: {}, affix: {}, glyph: {}}): KPI headline value slotlabel({font: {}, overflow}): KPI card label slotsupport({font: {}, format, tone, glyph: {}}): KPI support row slot Also exist:preferred_width,padding,background,font,min_card_width,default_height,border,content_padding.
kpi style.value: font, format, compact, affix, glyph.
kpi style.support:
tone(positive|negative|warning|info): Semantic color for the support value and glyph Also exist:font,format,glyph.
Table
a table's style:
wrap(bool): Allow cell text wrapping; false clips to single lineheader(mapping): Table header row stylerow({height, stripe: {}, divider: {}, roles: {}}): Table body row stylepagination({enabled, page_rows, mode}): Client-side pagination defaults for table chartscolumn_defaults({width, align, format, background, font: {}}): Table-level column defaults applied to every column; None means no defaults authoredcolumns(map of mapping): Per-column display configuration keyed by column name (label, format, width, etc.)row_numbers({visible, header, align, font: {}}): Leading row-number column configuration Also exist:title,preferred_width,padding,background,font,border,color,outer_padding,bottom_padding,column_layout,title_row,hide_underscore_columns,header_overflow,paginator,scrollbar,symbol_mode,more_rows,empty_state,spark,transpose,text_baseline_offset,title_subtitle_gap.
table style.header: visible, height, font, font_compact, background, overflow, divider.
table style.row:
height(number): Body row height in pixelsstripe({color}): Alternating row stripe style; None means no stripe Also exist:divider,roles.
table style.pagination: enabled, page_rows, mode.
table style.columns.<column>:
visible(bool): Whether this column renderslabel: Header, default the prettified column name (first_yearreads "First year")format(name|text|{spec, prefix, suffix, notation, sign_placement, repeat}): How the number is writtenalign(left|center|right): Text alignment in cells (left, center, right)width(int|text): Column width (integer pixels or CSS string like '10%')link(text|{url, open}): URL template for cell values, with the row's fields availablebackground: Cell background color (hex string, or 'transparent'/'none'), or a column IDfont(mapping): Cell font style overridesscale({background: {}, color: {}}): Continuous color mapping configuration for this columnglyph: Text shown before every cell valuespark(line|area|bar|bar-normalize|column|columns): Miniature chart drawn inside each cell Also exist:swatch,max_width,header_overflow,header_link,glyph_color.
conditional_formatting.<column>.when[], on a table or kpi: eq, ne, lt, lte, gt, gte, between, in, is_null, default, background, font, glyph, glyph_color, tone.
- ConditionalRule requires exactly one condition operator
- ConditionalRule glyph_color requires glyph to be set
Layouts with grid: (rare; a chart spanning rows):
grid:
columns(int, default 24): Grid columns, 24 unless set; write it only when it differsitems(list of mapping): Cells of this grid, each pairing content with its placement
grid.items[]:
item(text|mapping|map of mapping): Chart name or inline chart/board definition to place in this grid cellcol(int): Column position (0-indexed)row(int): Row position (0-indexed)col_span(int): Number of columns to span (width in grid units)row_span(int): Number of rows to span (height in grid units) Also exist:width,height,notes.
After any edit, run render_board(yaml_content=<yaml>) (or render_board(path=<board>) once saved) and fix what it reports until it reports no errors.