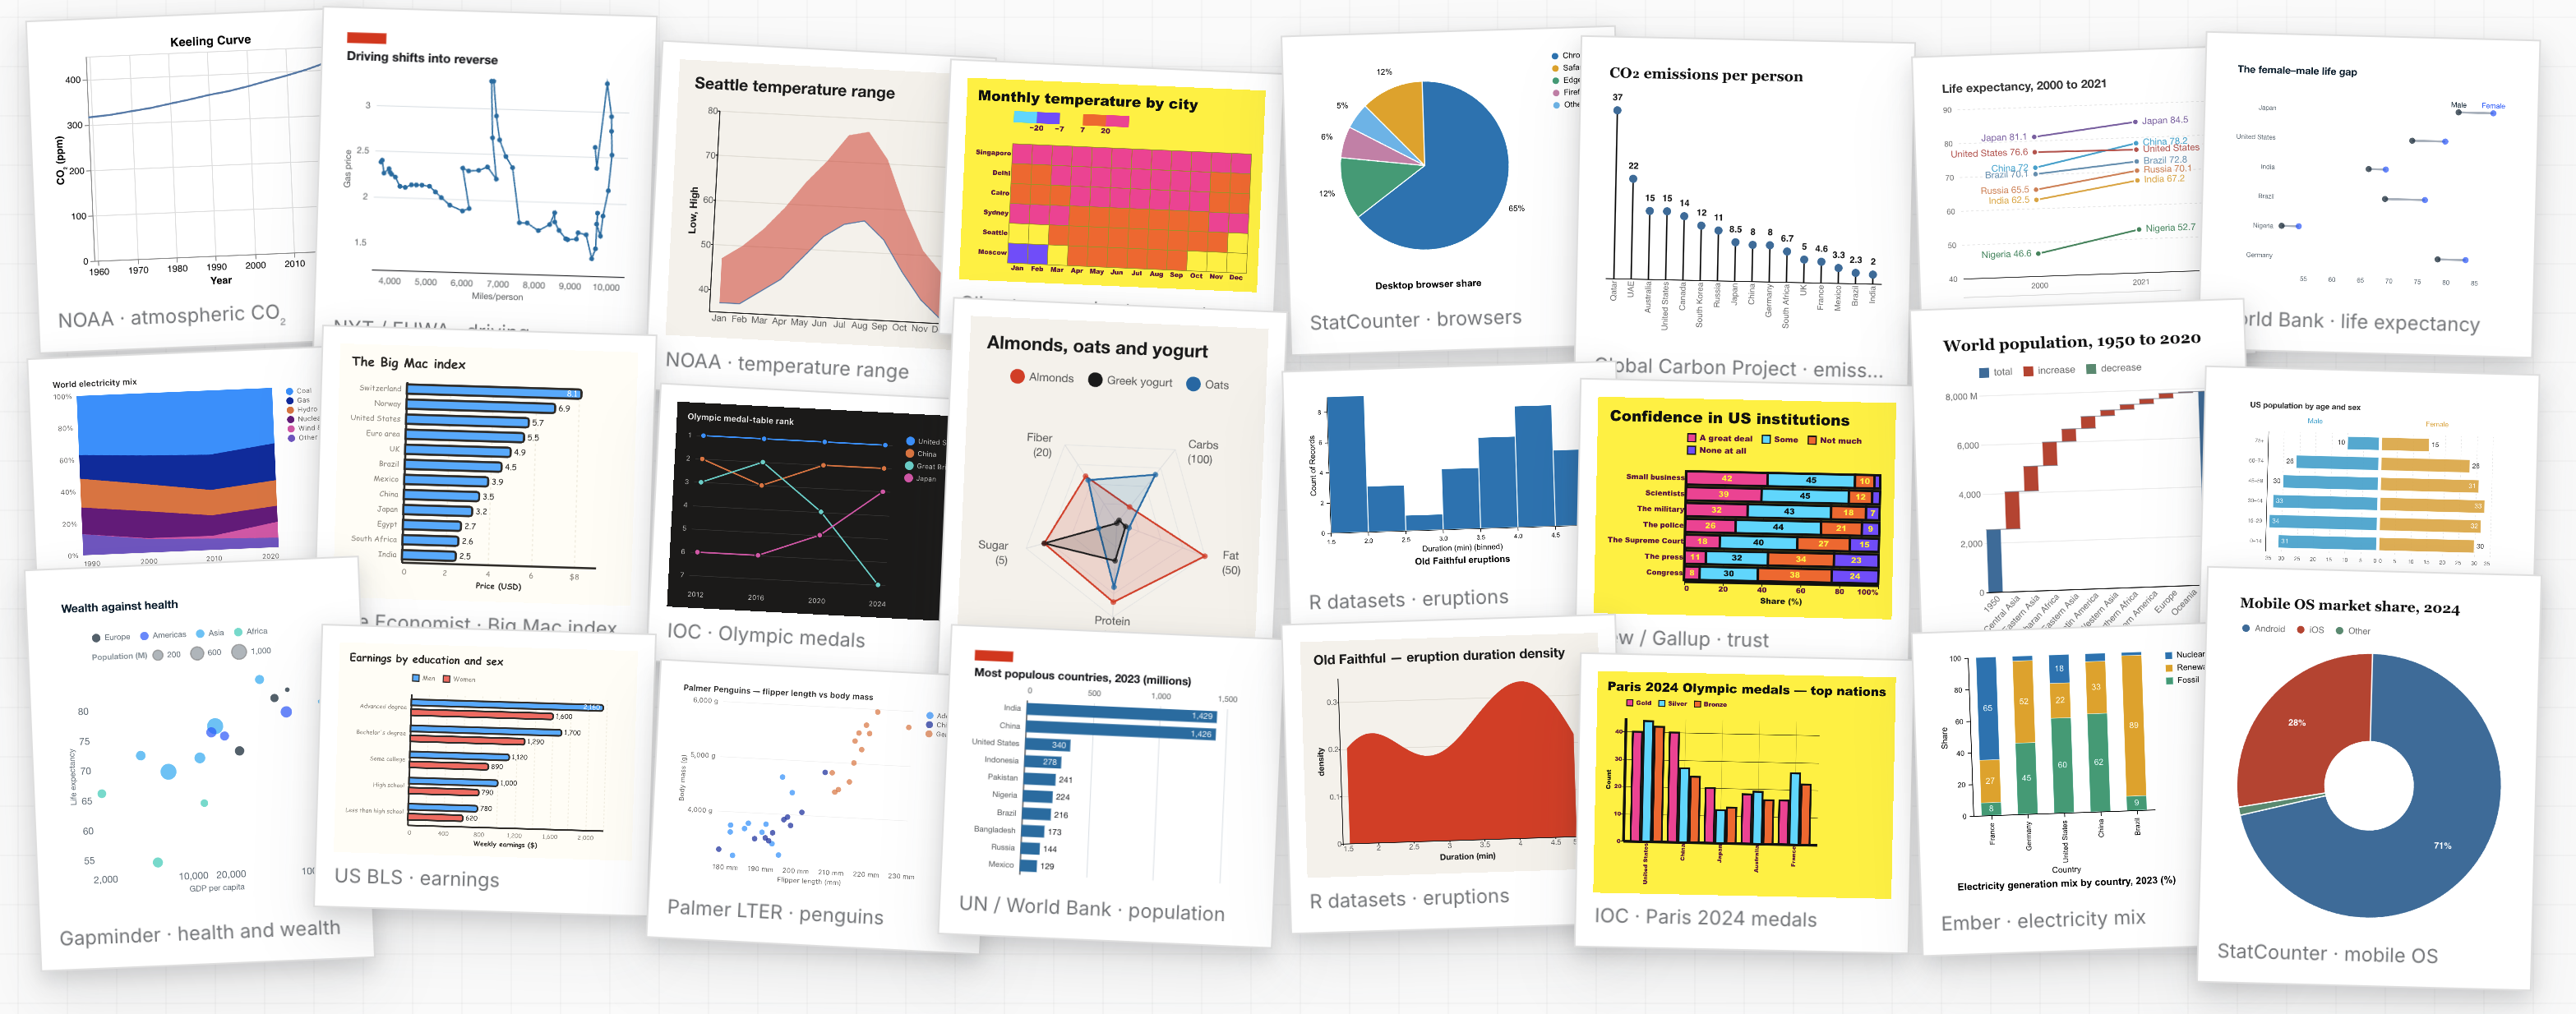
flint-chart: interactions and updates on a chart
Two things go beside a chart input, and both are optional:
interaction_spec: behaviour, what the reader can do. { "interactions": [ { "type": <preset>, "options"?: { … } } ] }.updates: state, marks the agent leaves on the chart (notes, emphasis, a
shaded range, a reference line). A list of { "id", "ops": [ … ] } layers.
A gesture's handler and an agent write the same layers, so when the request
is for something the reader can do themselves, give them the gesture; when it
is a point the agent makes, write the update. The chart itself is the
flint-chart-author skill. Everything here runs on the Vega-Lite backend; a
static render and the other backends ignore both. Code (mounting, onChange,
linking charts in an app, a gesture no preset gives) is the flint-app-author
skill; on an MCP board, charts connect through link_spec (the
flint-board-author skill).
Use only the names in this skill and in list_interaction_presets. When the
request asks for a behaviour no preset gives, say which preset comes closest
and what it leaves out.
Add interactions
When
A mounted chart already shows each mark's values in a tooltip, and a click on
a legend item dims the other groups. Add behaviour only for a reason:
- The user asks for it, by naming a gesture ("brush a period", "zoom",
"toggle the legend") or by describing what the chart should do ("click a
line so it stands out", "slide along the years", "let me pick the year").
"Make it interactive" is an ask with nothing named: one or two presets
that fit the chart.
- The chart works with other charts on a board: behaviour is what
connects the views.
- The data needs it to be read: more detail than the chart can show at
its size (a long dense series, a crowded cluster, a map) that the reader
will want to see closer. Shape the chart first (an aggregate, a scale, a
filter); behaviour is a way to move closer (
navigate, brush-zoom). Many
series is not this reason: fewer series is a shaping choice, and picking
them apart waits for the user to ask.
Otherwise add nothing. A question about the data is answered by the chart and
the reply, and a chart shown in a live view has asked for nothing.
Pick presets
Take the preset whose gesture the user named, or whose purpose meets what
they described, one per job and as few jobs as the reason holds: one or two
entries for most charts, none added to round out a set.
list_interaction_presets with chartType lists the presets the type
supports, what each needs, its reset and every option.
| Preset |
Gesture |
What it is for |
| Single one thing out |
|
|
click-highlight |
Clicks a mark, a legend item, or an axis label; it stays emphasised and the rest mute. Shift-click adds. |
Keeps one mark, series, or category in focus against the rest while the reader looks at it; in an app, the selection the app reads. |
click-group-focus |
Clicks a mark; every mark in its group stays emphasised. groupBy names the group field. |
Follows one group (a country's line, a species' points) across the chart from any of its marks. |
hover-group-focus |
Hovers a mark; its group stands out until the pointer leaves. groupBy names the group field; emphasis is "auto" (a line widens and the rest stay as drawn; points, bars, and slices dim the rest), "highlight", or "spotlight". |
Picks one group out of many overlapping ones at a glance, without a click. |
axis-highlight |
Clicks (or with event: "hover", hovers) a discrete axis label; that category's marks emphasise. |
Picks a whole row or column, a category or a month, through its axis label. |
| Read values |
|
|
inspect |
Moves over the plot; a guide follows the pointer and the nearest mark on the chosen axes reads out. mode picks the axes and a comparison ("x>" reads every mark past the pointer). |
Reads exact positions on guides: a crosshair on one or both axes, or every mark past a threshold. One mark's values are already in the tooltip. |
inspect-index |
Moves along the index axis; every series reads out at that position on one guide, each value labelled in its series colour and the position named at the axis. show: "single" reads one series and switches it through the legend; seriesBy names the series field when the chart draws one series at a time; displayValue: false keeps the guides and drops the labels. |
Reads several series at the same position side by side, on one guide. With one series it repeats the tooltip. |
| Focus a region |
|
|
select |
Drags a rectangle; the marks inside emphasise. mode: "stateful" keeps the rectangle on screen to move and resize. |
Picks out the marks in an area of a two-dimensional spread, to see which they are. |
lasso-select |
Draws a freehand region; the marks inside emphasise. |
Picks out an irregular cluster that a rectangle would not fit. |
brush-x, brush-y |
Drags an interval along one axis; the marks in it emphasise. mode: "stateful" keeps the interval on screen to move and resize. On a polar chart the x brush is a sector. |
Marks a period or a value range, to see what falls in it. |
brush-angle |
Drags an angular sector on a pie, donut, rose, or radar; the slices in it emphasise. |
Takes adjacent slices of a part-to-whole chart together. |
linked-brush |
Drags a region; the groups inside emphasise in every chart that mounts the same preset. groupBy names the shared field; mode: 'stateful' keeps the rectangle on screen to move or resize. |
Connects charts: groups picked in one show in every chart that shares the field. |
| Move the view |
|
|
navigate |
Drags to pan; wheels or pinches to zoom a continuous axis. axes limits it; pan: false leaves the plot drag free. On a map it moves the projection; on a globe (a world Choropleth with projection: "orthographic") a drag turns the sphere and the zoom stays centred. On a map, geometry.domain.focus names the region at the centre. |
Moves through a chart that holds more detail than fits at its size: a long series, a dense cluster, a map. |
brush-zoom |
Drags a rectangle; the chart flies into it. |
Jumps into one stretch or box of a dense chart, and back out. |
| Reduce or rearrange |
|
|
legend-toggle |
Clicks a legend item; its series hides or returns. Hidden series are a setting and survive every reset. |
Takes series out of view and brings them back, so the rest read without them. |
drag-reorder |
Drags a discrete axis label to a new place; the categories reorder. |
Lets the reader set the order of the categories. |
filter-controls |
Picks values in controls beside the chart; the rows that fail are removed, or muted with mode: "highlight". One control per listed field. |
Switches the chart between subsets of a field it does not draw: a year, a group, a scenario. |
| Mark for the reader |
|
|
click-annotate |
Clicks a mark; a note with its value pins to it. |
Leaves the values of chosen marks written on the chart, where there is room beside them for a note. |
| Hand a gesture to the app |
|
|
double-activate |
Double-clicks a mark; the mark activates and the host reads it. |
Hands a mark to the app as an action, apart from selecting it. |
long-press |
Holds a mark (500 ms); the mark activates. The touch spelling of the same activation. |
The same hand-off, on touch. |
context-activate |
Right-clicks or long-presses a mark; the host receives a context target and draws its own menu. |
Hands a mark to a menu the app draws. |
context-menu |
The reader picks marks and a menu of the app's actions opens beside them; picking one emits menu-select with the item's id and the marks. gesture picks how: rectangle (default), lasso, brush-x, brush-y, click, right-click, long-press. items is required: [{ "id", "label" }]. One entry; it brings its own selection. |
Offers the app's actions on the marks the reader picks, in a menu Flint draws. |
| Read without a pointer |
|
|
accessible-navigation |
Tabs into the chart and walks titles, axes, legends, facet headers, series, and marks with the arrow keys; Enter goes a level in, and inside a level Tab steps through it before moving on. Each step says what the element is and emphasises its data. Space on a focused element runs the click presets. |
Makes the chart readable from the keyboard and a screen reader. |
Within a family the rows answer neighbouring questions, so one chart takes
one of them: inspect reads the marks near the pointer, inspect-index reads
every series at one index; select takes an area, brush-x a period, lasso
a shape; navigate moves continuously, brush-zoom jumps into a box;
double-activate, long-press, and context-activate are three spellings of
"hand this mark to the app" for a mouse, a finger, and a menu.
filter-controls. It draws real controls beside the chart and changes the
rows the chart shows, so it answers a request that names a field to filter by
("filter by region", "one year at a time", "let me pick the group"), or a data
column the chart does not encode whose values are versions of the same chart:
a year in a snapshot scatter, a population group, a scenario. A field the
chart already draws has its own preset: the colour field legend-toggle, a
continuous axis brush-x or navigate, a category on an axis
click-highlight; and the measure the chart plots is the chart. List fields
explicitly, one or two, three at most: unlisted, the preset picks up to four
categorical and temporal fields itself. One entry per chart. A fixed subset
belongs in the data, and slices side by side are a facet in the
flint-chart-author skill.
Conflicts
Each trigger has one owner; a later entry that asks for a taken trigger
yields it with an info warning, or is dropped with a warning when it
cannot work without it. Four triggers are shared:
| Trigger |
Asked for by |
Free it with |
| The plot drag |
navigate with pan on, every region preset, brush-zoom, drag-reorder |
"pan": false on navigate beside one region preset |
| The double-click |
double-activate, and any entry whose reset holds double-click (navigate and brush-zoom by default) |
"reset": ["escape"] on navigate or brush-zoom |
| The legend click |
legend-toggle, click-highlight, inspect-index with show: "single" |
"targets": ["mark"] on click-highlight |
| The retained mark focus |
click-highlight, click-group-focus |
one of them |
accessible-navigation takes no pointer trigger, so it sits beside any
entry. The data confirms what the chart type cannot promise. An entry that fails one
of these at mount is dropped with a warning:
legend-toggle needs a colour field bound to a discrete legend.navigate and brush-zoom need a continuous, unfaceted axis.drag-reorder needs a discrete axis in the bound encodings.inspect-index needs an index axis, which it finds itself: the temporal
axis, else the discrete axis beside a measure, else x. A horizontal bar
chart reads along y with no option; axis overrides the choice. seriesBy
names the series field when the chart draws one series at a time.click-group-focus, hover-group-focus, and linked-brush need groupBy,
a bound field.
Write and validate
Every entry is { "type": <preset>, "id"?: <string>, "options"?: { ... } }:
options nest under options (reset is one of them, set only to free a
trigger), and id sits on the entry, needed only when one preset appears
twice.
{
  "interactions": [
    { "type": "click-highlight", "options": { "targets": ["mark"] } },
    { "type": "legend-toggle" }
  ]
}
show checks it as it draws (validate_chart without a card).
An unknown type, an option beside type, an id inside options or a
missing required option is an error. A dropped or yielded entry is a warning
that names the entry and what it needed:
Interaction "legend-toggle" requires a discrete legend; Bar Chart has none. The interaction was dropped.
Fix or drop what it warns about.
Update the chart
A chart opens clean. updates add the agent's own marks to it only for one
of these reasons; without one, what the agent wants to say goes in its reply.
- The user asks for marks on the chart. They name one ("label the peak",
"highlight Japan", "a line at $3", "shade the recession"), or describe a
chart that has to tell its point on its own ("for a slide").
- The user asks about a chart already on screen. The answer points at
the chart: emphasise the rows, note the value, frame the range.
- A requested interaction needs a starting state. "Look at one year,
then slide along" opens on that year with
set-viewport.
- A concrete question, pointed at lightly, as below.
Muted annotations
A question about particular values (a peak, a value at a date, a difference,
a crossing, a threshold, which items pass one) may point at its answer
without being asked. An overview question ("how did it move", "is there a
relationship") gets none.
- The title says it; the annotation points. The answer is in the title
(and the reply). On the chart, only what directly answers the question: one
mark, two for a difference or a crossing, one span, or one small set.
- A label names what it points at. A few words that still mean something
on their own: the value and what identifies it ("$5.01 · Jun 13, 2022",
"China 26, Russia 23"). Not a bare tag ("Peak", "Max"), not a sentence, not
a repeat of the title or of a value label the chart already prints.
- Room decides the form, not the chart type. Where there is open space
beside the answer, a short label. Where marks fill the space round it (a
full grid of cells, a dense cluster, a bar that already prints its value),
the highlight alone:
annotate-text with text: "" draws the ring or
outline and no caption. Many answers (more than three or four) get emphasis
with no labels, and the list goes in the reply.
- Light forms. A mark:
annotate-text with the default highlight: 'light', or 'strong' for an outline. A span or band: one
annotate-region under the marks, low opacity, a caption only when the
title does not give the range and the plot has room above it. A small set:
set-style with state: 'emphasized', emphasis: 'light', or an outline
per member. A clear cluster: one annotate-enclosure, no caption when the
legend names it. A value the question names: a plain set-overlay rule.
- The answer is in view. A pointer on a mark the reader cannot see is
nothing. On a chart that scrolls or opens zoomed (a long heatmap, a wide
calendar), narrow the data to the stretch that holds the answer, or open
the viewport on it.
- Not muted: notes that tell a story, several shaded episodes, context the
question did not ask about,
strong or exclusive emphasis. Those need an
ask (reason 1).
Text and paint come from the theme: notes take its annotation type, rings,
outlines and enclosures its interaction.highlight. Set them per update
(value.style, value.highlightStyle) only when the user asks.
The state
After every build and every committed gesture, the MCP chart view sends the
agent the card's state in field terms: the chart after the reader's panel
edits, each op of your updates as applied (✓) or not and why (✗), what the
reader selected, hid or filtered, and the viewport. Read it before writing,
so an update does not undo what the reader set. The rows you were given are
the source of every value; nothing is computed that the chart cannot verify.
Ops
| Op |
It is for |
Effect |
Shape |
Needs |
set-style |
The marks the chart already draws: emphasize some, fade some, hide some, recolour some. A highlight is this op with state: 'emphasized'. |
Emphasize the targets and recede the rest; recolour; fade; hide. emphasis sets how far the rest recede: 'light' (default; they stay readable), 'strong', 'exclusive' (only the targets read). |
{ op, targets: UpdateTarget[], value: StyleSpec } |
marks |
annotate-text |
One mark, a stretch of a line or area, a leg of a map route (visual: { kind: 'path' } on the row it leaves from), a slice or a region that should carry a note. |
Set a caption beside it: plain words haloed in the page, a leader only where needed, never a card; null clears it. highlight marks what it names: 'none', 'light' (default), 'strong', 'exclusive' (the rest recede, so no separate set-style emphasis is needed). The caption takes the theme's annotation type (else the axis labels' face a size up); style sets one note's fontSize, fontWeight or color; highlightStyle: { color, width } its ring or outline, over the theme's interaction.highlight. text: "" draws the highlight alone (an outline or ring, no caption); with text omitted the chart words the note itself. For a boxed callout use set-overlay or set-freeform-overlay. set-annotation is its deprecated name; do not write it. |
{ op, target: UpdateTarget, value: { text, anchor?: 'segment' | 'point', highlight?, style?: { fontSize?, fontWeight?, color? }, highlightStyle?: { color?, width? } } | null } |
one resolved element |
annotate-region |
A stretch of the plot: a period, a band of values, a box, a run of categories. |
Shade it, with an optional caption set on it; null clears it. |
{ op, name, value: { x?: [lo, hi] | categories, y?: [lo, hi] | categories, text?, color?, opacity?, layer?: 'under' | 'over', placement?: 'top' | 'bottom' | 'left' | 'right' | 'center' | 'above' | 'below' } | null }; on a map longitude: [west, east], latitude: [south, north] in place of x and y |
x or y scales, or a map (not a pie or radar) |
annotate-enclosure |
A group of marks that belong together: a cluster, a run of bars, a block of cells. |
Outline each target group; one optional caption shared by them, with leaders to two or three outlines; null clears it. |
{ op, name, value: { targets: UpdateTarget[], text?, shape?: 'hull' | 'rect' | 'ellipse' | 'circle', connect?: 'auto' | 'all' | 'none', color?, width? } | null } |
marks |
set-viewport |
The range or region the chart should frame. |
Frame a continuous domain. |
{ op, axes: 'x' | 'y' | 'xy', value: { x?: [lo, hi], y?: [lo, hi] } }; on a multi-level map value: { region: { key } } |
navigate or brush-zoom mounted on that axis |
set-order |
The order of the categories on a discrete axis. |
Reorder the axis; list every category in the order wanted. |
{ op, scope: 'category', field, values: unknown[] } |
drag-reorder mounted on that axis |
set-overlay |
Marks the chart does not draw: a reference line, a threshold band, a forecast, a sketch of rows. |
Draw new rows through the plot's own scales. |
{ op, name, value: { mark, data: { values }, encodings: { x?, y?, x2?, y2?, order?, color?, text? }, role, interactive?, projectable?, style? } | null }; on a map longitude, latitude (and longitude2, latitude2 for a rule or rect) in place of x and y |
x and y scales, or a map |
set-freeform-overlay |
A custom shape with no data behind it. |
Draw SVG, or a clone of marks, over the plot. |
{ op, name, value: { coordinateSpace: 'plot' | 'renderer', body: [{ type: 'svg', content } | { type: 'clone', targets, transform?, opacity? }] } | null } |
— |
set-data |
The rows the chart draws, for playback or a swap. |
Replace every row; the rows carry every encoded field. |
{ op, source: 'main', value: { rows } } |
inline data |
StyleSpec is { state?, emphasis?, opacity?, visible?, fill?, stroke?, strokeWidth?, mutedOpacity? }. Two states matter from outside: emphasized
keeps the targets at full ink and recedes every other mark by emphasis
('light' by default, 'strong', 'exclusive'; mutedOpacity sets the level
outright); normal with targets: [] clears the layer. opacity on the
targets fades a subset and leaves the rest alone; opacity: 0 hides marks and
keeps the axes, where visible: false removes the rows and shrinks the scales.
Overlay marks are line, point, rule, rect, text. encodings name
fields of the overlay's own rows, projected through the chart's x, y, and
colour scales. style takes stroke, strokeWidth, strokeDash (lengths, or
'dash' / 'dot'), fill,
fillOpacity, opacity, pointRadius, fontSize, fontWeight, fontStyle (italic), textAlign
(start, middle, end), dx, dy. A line takes its stroke and a text
its fill from the color encoding; a point takes style.fill. A text sits on
the data, so it draws a halo in the chart's background; stroke sets another
colour, strokeWidth its width, and stroke: 'none' drops it, as a faint
watermark wants.
Two ops need a preset the chart mounts: set-viewport needs navigate or
brush-zoom on that axis, set-order needs drag-reorder. The host says
which are mounted, or the state shows viewport and categoryOrder. On a
chart that mounts neither, say so and offer an emphasis; set-data replaces
what the chart shows and is not a frame. Legend values belong to
legend-toggle: no update hides or restores one, and a series fades with
opacity instead.
Targets and values
A target is one of three forms:
{ select: { key: { Country: 'Japan' } } }                 // marks with these values
{ select: { where: { Region: { in: ['Asia', 'Europe'] }, Month: { range: ['2025-03', '2025-06'] } } } }  // a set of marks
{ visual: { kind: 'mark', role: 'mark' }, elements }      // elements from an event or the state
A where describes a set, in the words filters use: each field in a list
or within a range (ends included; null leaves an end open), and every
field must hold. Use it for a period, a band of values, or several categories
at once, where a key would need one target per row. set-style and an
enclosure's targets take a where; a note or an order names one mark, so it
takes a key.
Use the annotation ops to put a message on the chart: a note
(annotate-text) on a mark, a shaded region (annotate-region) over a
stretch of the plot (two bounds on a continuous axis, null for the plot's
end, or adjacent categories on a banded one), or an outline
(annotate-enclosure) round a group of marks, each with optional text.
Leave colour, shape and placement to the chart unless the request names
them. A note marks its own target through highlight; do not pair it with
a set-style emphasis to make the mark stand out. A stretch of a line or
area that spans a period is a region, not a note on one segment.
A selector key names fields the chart encodes (x, y, color, detail,
size, …) and matches rows by equality, so '2007' and 2007 differ. One
key may cover many marks ({ Continent: 'Africa' } takes every African
mark); several fields narrow it; an annotation's key covers one. On a line
or area chart, a key on the series field covers the whole line and a key on
the x field covers the segment that starts at that row, so a run of segments
is one target per row. The last row of a line starts no segment; its key
takes the segment that ends there. A note on an x key marks the segment, for
a change from one row to the next ("2019 → 2020: +4%"); anchor: "point"
marks the row's own point, for its value ("Dec 2022: $0.87B"). A note on
the last row is always at its point.
Annotation text says what the chart does not ("Promotion launched", "Lowest
in Q3"), not a value or label it already prints (note_repeats_chart). The
title states the finding; a note puts its specifics on the mark, and names
the mark where the chart does not (a dot on a scatter).
A field the chart does not encode resolves to nothing. Encode the identity
field (detail on a scatter), or pass elements from event.target,
state.selected, or context.available through as { visual, elements },
as they are: an element's value carries derived fields on a bar, pie,
heatmap, or waterfall mark (a stack start, a sort index), so the element
resolves where a key copied from it does not.
A target that matches nothing is listed in the result as unresolved, and
nothing nearby is taken in its place.
A key value, an overlay row, and a viewport bound hold what the parsed row
holds: a CSV 120 is the number 120. A temporal field (Year,
YearMonth, Date, …) takes a date written the way the data writes it
("2014-01", 2014 on a Year field) or UTC epoch milliseconds. On a
discrete axis the value is the category. Overlay rows need the fields their
mark reads: line, point, text read x and y. A rule with only x
is a vertical line across the plot, and one with only y a horizontal
threshold; a rect with only x and x2 is a full-height band, and one with
only y and y2 a full-width band. With all four channels, rule and rect
run from (x, y) to (x2, y2). An overlay whose rows do not project is
reported as unsupported.
{ "id": "agent", "ops": [
  { "op": "set-style", "value": { "state": "emphasized" },
    "targets": [{ "select": { "key": { "month": "2014-01" } } }, { "select": { "key": { "month": "2014-02" } } }] },
  { "op": "set-overlay", "name": "threshold", "value": { "mark": "rule", "role": "reference",
    "data": { "values": [{ "y": 1e9 }] }, "encodings": { "y": { "field": "y" } } } },
  { "op": "set-overlay", "name": "period", "value": { "mark": "rect", "role": "band",
    "data": { "values": [{ "start": "2022-11", "end": "2026-08" }] },
    "encodings": { "x": { "field": "start" }, "x2": { "field": "end" } }, "style": { "fillOpacity": 0.12 } } }
] }
Layers
Ids are layers. One id holds one concern: the agent's update, a story
step, a linked selection. Use one stable id, such as agent, and send the
whole layer each time:
- An update with an id already retained replaces that layer, and carries only
what it lists: an omitted viewport flies home, an omitted order returns to
the input order, an omitted annotation disappears. The ops that should hold
are repeated; the ops the request replaces are dropped.
- Layers compose in insertion order, and a replaced layer keeps its place:
styles accumulate across layers; for an annotation, an order, a data swap,
or an overlay name, the layer inserted last wins. One kind of op lives in
one layer: a drag and a playback that both swap the rows write the same id.
- A canvas interaction retains its layer under its own
id; a host may write
or clear that layer by the id, as a Reset button does.
- A gesture reset (
click-none, escape, double-click) clears preset
layers only. A host layer stays until the host clears it, or until a layer
with set-style, targets: [], state: 'normal' replaces it.
- After
set-data the marks are new; a style layer is sent again with the
data.
Send it
Pass the layers as updates, a key of the chart input beside data and
chart_spec (not inside chart_spec), to show as part of chart, or to
validate_chart for the report without a card:
{
  "data": { "values": [ ... ] },
  "chart_spec": { "chartType": "Bar Chart", "encodings": { "x": "region", "y": "revenue" } },
  "updates": [
    { "id": "agent", "ops": [
      { "op": "set-style", "targets": [{ "select": { "key": { "region": "East" } } }], "value": { "state": "emphasized" } },
      { "op": "annotate-text", "target": { "select": { "key": { "region": "West" } } }, "value": { "text": "Lowest in Q3" } }
    ] }
  ]
}
show opens the chart with the layers applied, with the same look as a
user action. To show the chart in a new state, call show again with the same
input and the layers wanted now. Each show opens a new card with
exactly those layers; earlier cards keep what they showed. The argument is state, and interaction_spec is behaviour, so
each stays where it is. The reader's own brush or selection does not survive
the new view; the context message reports it in field terms, and it is
carried as a layer when it still serves the reader.
A malformed layer or an invalid spec is an error, and show draws nothing
for it. Otherwise the report lists each op that will not apply, and why, led
by a count. The chart draws without a ✗ op: fix it in the layer (a key no row has,
an overlay encoding written as "x": "start" instead of { "field": "start" },
a viewport with no navigation preset) before you call show, or tell the
reader what is missing. The
reader's later brushes and clicks reach you with their next message, not in
the same turn.
Worked examples
In each example data is a placeholder; the host binds real rows.
Presets: a named gesture
User: "An interactive chart that I can brush." A line chart of sales by
month, one series.
{ "interactions": [ { "type": "brush-x" } ] }
The user named one job, a brush along the period axis, and the row for it is
brush-x. Hover already reads the values.
Presets: a goal on a category chart
User: "Which regions stand out? Let me look." A bar chart of revenue by
region, no colour field.
The reader singles out a region and compares orders. click-highlight singles
one out; drag-reorder lets the reader rank by hand. No colour field is
bound, so legend-toggle has nothing to work with. Both presets ask for a
different trigger, a click on a bar and a drag on an axis label.
{
  "interactions": [
    { "type": "click-highlight" },
    { "type": "drag-reorder" }
  ]
}
Presets: comparing a few series
User: "Make this interactive so I can compare the three regions month by
month." A line chart of sales by month, color: region.
The user asks for behaviour and names the job: comparing the series at one
month. inspect-index reads all three at the month under the pointer, which
the tooltip (one line at a time) does not. Nothing else was asked for.
{ "interactions": [ { "type": "inspect-index" } ] }
ChartUpdate: an agent points out rows
User: "Which Asian countries are past 80 years? Point them out." The chart on
screen is a scatter of gdp by life with color: continent,
detail: country and navigate on y, and the state says nothing is
emphasized. The agent finds Japan and Singapore in its rows and answers:
{
  "id": "agent",
  "ops": [
    { "op": "set-style",
      "targets": [
        { "select": { "key": { "country": "Japan" } } },
        { "select": { "key": { "country": "Singapore" } } }
      ],
      "value": { "state": "emphasized" } },
    { "op": "annotate-text",
      "target": { "select": { "key": { "country": "Japan" } } },
      "value": { "text": "Japan, 82.6 years" } },
    { "op": "set-viewport", "axes": "y", "value": { "y": [70, 86] } }
  ]
}
country resolves because it is encoded on detail. The result returns
applied with two resolved targets; a key with "Country" would come back
unresolved, and the agent fixes the spelling before it describes the chart.
Validation checklist
For an interaction_spec:
- It parses as strict JSON and is a bare object with
interactions.
- Every entry has a reason (the user asked, the chart is linked, or the data
needs it to be read) and a job the tooltip and legend do not do.
- Every
type is in the chart type's list from list_chart_types, and every
option is under options with id on the entry.
groupBy and seriesBy are present where required, and name bound fields.- At most one entry owns the plot drag, the double-click, the legend click,
and the retained mark focus.
- The report notes no dropped or yielded entry.
For updates or a ChartUpdate:
- Every
op and state is one from the op table.
- Every selector key names encoded fields with values that exist in the rows.
- The update is the whole layer for its id; clearing uses
targets: [] with
state: 'normal'.
- Ops that need a mounted preset have it, or
unsupportedOps has been read
and acted on.
- The result came back
applied before you said what the chart shows.
Preset options
list_interaction_presets returns every preset with what it needs from the
chart, its reset gestures, and every option it accepts under options, with
each option's type and note; type narrows it to one preset and chartType
to the presets a chart type supports. In code, the same options are the
factory's parameter type in flint-chart/interactive. id is never an
option: it sits on the entry. A ResetGesture is click-none,
double-click, or escape. dimOpacity is the opacity of the muted marks,
0.25 by default. A guide is { visible?, style? }, or false to draw
nothing while the gesture runs.
1---2name: flint-interaction-author3description: "Use when: a chart should carry notes, shaded regions, outlines, emphasis or reference lines (updates); a Flint chart should respond to the reader (highlight, zoom, brush, legend toggle, reorder, filter); or an agent changes a chart on screen. Produce one valid interaction_spec or ChartUpdate, with no invented names. Code against flint-chart/interactive (mounting, linking in an app, a bespoke gesture) is the flint-app-author skill."4metadata:5 source: https://skillmd.com/skills/microsoft/flint-interaction-author6---78# flint-chart: interactions and updates on a chart910Two things go beside a chart input, and both are optional:1112- `interaction_spec`: behaviour, what the reader can do. `{ "interactions": [ { "type": <preset>, "options"?: { … } } ] }`.13- `updates`: state, marks the agent leaves on the chart (notes, emphasis, a14 shaded range, a reference line). A list of `{ "id", "ops": [ … ] }` layers.1516A gesture's handler and an agent write the same layers, so when the request17is for something the reader can do themselves, give them the gesture; when it18is a point the agent makes, write the update. The chart itself is the19`flint-chart-author` skill. Everything here runs on the Vega-Lite backend; a20static render and the other backends ignore both. Code (mounting, `onChange`,21linking charts in an app, a gesture no preset gives) is the `flint-app-author`22skill; on an MCP board, charts connect through `link_spec` (the23`flint-board-author` skill).2425Use only the names in this skill and in `list_interaction_presets`. When the26request asks for a behaviour no preset gives, say which preset comes closest27and what it leaves out.2829## Add interactions3031### When3233A mounted chart already shows each mark's values in a tooltip, and a click on34a legend item dims the other groups. Add behaviour only for a reason:35361. **The user asks for it**, by naming a gesture ("brush a period", "zoom",37 "toggle the legend") or by describing what the chart should do ("click a38 line so it stands out", "slide along the years", "let me pick the year").39 "Make it interactive" is an ask with nothing named: one or two presets40 that fit the chart.412. **The chart works with other charts** on a board: behaviour is what42 connects the views.433. **The data needs it to be read**: more detail than the chart can show at44 its size (a long dense series, a crowded cluster, a map) that the reader45 will want to see closer. Shape the chart first (an aggregate, a scale, a46 filter); behaviour is a way to move closer (`navigate`, `brush-zoom`). Many47 series is not this reason: fewer series is a shaping choice, and picking48 them apart waits for the user to ask.4950Otherwise add nothing. A question about the data is answered by the chart and51the reply, and a chart shown in a live view has asked for nothing.5253### Pick presets5455Take the preset whose gesture the user named, or whose purpose meets what56they described, one per job and as few jobs as the reason holds: one or two57entries for most charts, none added to round out a set.58`list_interaction_presets` with `chartType` lists the presets the type59supports, what each needs, its reset and every option.6061| Preset | Gesture | What it is for |62| --- | --- | --- |63| **Single one thing out** | | |64| `click-highlight` | Clicks a mark, a legend item, or an axis label; it stays emphasised and the rest mute. Shift-click adds. | Keeps one mark, series, or category in focus against the rest while the reader looks at it; in an app, the selection the app reads. |65| `click-group-focus` | Clicks a mark; every mark in its group stays emphasised. `groupBy` names the group field. | Follows one group (a country's line, a species' points) across the chart from any of its marks. |66| `hover-group-focus` | Hovers a mark; its group stands out until the pointer leaves. `groupBy` names the group field; `emphasis` is `"auto"` (a line widens and the rest stay as drawn; points, bars, and slices dim the rest), `"highlight"`, or `"spotlight"`. | Picks one group out of many overlapping ones at a glance, without a click. |67| `axis-highlight` | Clicks (or with `event: "hover"`, hovers) a discrete axis label; that category's marks emphasise. | Picks a whole row or column, a category or a month, through its axis label. |68| **Read values** | | |69| `inspect` | Moves over the plot; a guide follows the pointer and the nearest mark on the chosen axes reads out. `mode` picks the axes and a comparison (`"x>"` reads every mark past the pointer). | Reads exact positions on guides: a crosshair on one or both axes, or every mark past a threshold. One mark's values are already in the tooltip. |70| `inspect-index` | Moves along the index axis; every series reads out at that position on one guide, each value labelled in its series colour and the position named at the axis. `show: "single"` reads one series and switches it through the legend; `seriesBy` names the series field when the chart draws one series at a time; `displayValue: false` keeps the guides and drops the labels. | Reads several series at the same position side by side, on one guide. With one series it repeats the tooltip. |71| **Focus a region** | | |72| `select` | Drags a rectangle; the marks inside emphasise. `mode: "stateful"` keeps the rectangle on screen to move and resize. | Picks out the marks in an area of a two-dimensional spread, to see which they are. |73| `lasso-select` | Draws a freehand region; the marks inside emphasise. | Picks out an irregular cluster that a rectangle would not fit. |74| `brush-x`, `brush-y` | Drags an interval along one axis; the marks in it emphasise. `mode: "stateful"` keeps the interval on screen to move and resize. On a polar chart the x brush is a sector. | Marks a period or a value range, to see what falls in it. |75| `brush-angle` | Drags an angular sector on a pie, donut, rose, or radar; the slices in it emphasise. | Takes adjacent slices of a part-to-whole chart together. |76| `linked-brush` | Drags a region; the groups inside emphasise in every chart that mounts the same preset. `groupBy` names the shared field; `mode: 'stateful'` keeps the rectangle on screen to move or resize. | Connects charts: groups picked in one show in every chart that shares the field. |77| **Move the view** | | |78| `navigate` | Drags to pan; wheels or pinches to zoom a continuous axis. `axes` limits it; `pan: false` leaves the plot drag free. On a map it moves the projection; on a globe (a world Choropleth with `projection: "orthographic"`) a drag turns the sphere and the zoom stays centred. On a map, `geometry.domain.focus` names the region at the centre. | Moves through a chart that holds more detail than fits at its size: a long series, a dense cluster, a map. |79| `brush-zoom` | Drags a rectangle; the chart flies into it. | Jumps into one stretch or box of a dense chart, and back out. |80| **Reduce or rearrange** | | |81| `legend-toggle` | Clicks a legend item; its series hides or returns. Hidden series are a setting and survive every reset. | Takes series out of view and brings them back, so the rest read without them. |82| `drag-reorder` | Drags a discrete axis label to a new place; the categories reorder. | Lets the reader set the order of the categories. |83| `filter-controls` | Picks values in controls beside the chart; the rows that fail are removed, or muted with `mode: "highlight"`. One control per listed field. | Switches the chart between subsets of a field it does not draw: a year, a group, a scenario. |84| **Mark for the reader** | | |85| `click-annotate` | Clicks a mark; a note with its value pins to it. | Leaves the values of chosen marks written on the chart, where there is room beside them for a note. |86| **Hand a gesture to the app** | | |87| `double-activate` | Double-clicks a mark; the mark activates and the host reads it. | Hands a mark to the app as an action, apart from selecting it. |88| `long-press` | Holds a mark (500 ms); the mark activates. The touch spelling of the same activation. | The same hand-off, on touch. |89| `context-activate` | Right-clicks or long-presses a mark; the host receives a context target and draws its own menu. | Hands a mark to a menu the app draws. |90| `context-menu` | The reader picks marks and a menu of the app's actions opens beside them; picking one emits `menu-select` with the item's id and the marks. `gesture` picks how: `rectangle` (default), `lasso`, `brush-x`, `brush-y`, `click`, `right-click`, `long-press`. `items` is required: `[{ "id", "label" }]`. One entry; it brings its own selection. | Offers the app's actions on the marks the reader picks, in a menu Flint draws. |91| **Read without a pointer** | | |92| `accessible-navigation` | Tabs into the chart and walks titles, axes, legends, facet headers, series, and marks with the arrow keys; Enter goes a level in, and inside a level Tab steps through it before moving on. Each step says what the element is and emphasises its data. Space on a focused element runs the click presets. | Makes the chart readable from the keyboard and a screen reader. |9394Within a family the rows answer neighbouring questions, so one chart takes95one of them: `inspect` reads the marks near the pointer, `inspect-index` reads96every series at one index; `select` takes an area, `brush-x` a period, `lasso`97a shape; `navigate` moves continuously, `brush-zoom` jumps into a box;98`double-activate`, `long-press`, and `context-activate` are three spellings of99"hand this mark to the app" for a mouse, a finger, and a menu.100101**`filter-controls`.** It draws real controls beside the chart and changes the102rows the chart shows, so it answers a request that names a field to filter by103("filter by region", "one year at a time", "let me pick the group"), or a data104column the chart does not encode whose values are versions of the same chart:105a year in a snapshot scatter, a population group, a scenario. A field the106chart already draws has its own preset: the colour field `legend-toggle`, a107continuous axis `brush-x` or `navigate`, a category on an axis108`click-highlight`; and the measure the chart plots is the chart. List `fields`109explicitly, one or two, three at most: unlisted, the preset picks up to four110categorical and temporal fields itself. One entry per chart. A fixed subset111belongs in the data, and slices side by side are a facet in the112`flint-chart-author` skill.113114### Conflicts115116Each trigger has one owner; a later entry that asks for a taken trigger117yields it with an `info` warning, or is dropped with a warning when it118cannot work without it. Four triggers are shared:119120| Trigger | Asked for by | Free it with |121| --- | --- | --- |122| The plot drag | `navigate` with pan on, every region preset, `brush-zoom`, `drag-reorder` | `"pan": false` on `navigate` beside one region preset |123| The double-click | `double-activate`, and any entry whose `reset` holds `double-click` (`navigate` and `brush-zoom` by default) | `"reset": ["escape"]` on `navigate` or `brush-zoom` |124| The legend click | `legend-toggle`, `click-highlight`, `inspect-index` with `show: "single"` | `"targets": ["mark"]` on `click-highlight` |125| The retained mark focus | `click-highlight`, `click-group-focus` | one of them |126127`accessible-navigation` takes no pointer trigger, so it sits beside any128entry. The data confirms what the chart type cannot promise. An entry that fails one129of these at mount is dropped with a warning:130131- `legend-toggle` needs a colour field bound to a discrete legend.132- `navigate` and `brush-zoom` need a continuous, unfaceted axis.133- `drag-reorder` needs a discrete axis in the bound encodings.134- `inspect-index` needs an index axis, which it finds itself: the temporal135 axis, else the discrete axis beside a measure, else x. A horizontal bar136 chart reads along y with no option; `axis` overrides the choice. `seriesBy`137 names the series field when the chart draws one series at a time.138- `click-group-focus`, `hover-group-focus`, and `linked-brush` need `groupBy`,139 a bound field.140141### Write and validate142143Every entry is `{ "type": <preset>, "id"?: <string>, "options"?: { ... } }`:144options nest under `options` (`reset` is one of them, set only to free a145trigger), and `id` sits on the entry, needed only when one preset appears146twice.147148```json149{150 "interactions": [151 { "type": "click-highlight", "options": { "targets": ["mark"] } },152 { "type": "legend-toggle" }153 ]154}155```156157`show` checks it as it draws (`validate_chart` without a card).158An unknown `type`, an option beside `type`, an `id` inside `options` or a159missing required option is an error. A dropped or yielded entry is a warning160that names the entry and what it needed:161162```163Interaction "legend-toggle" requires a discrete legend; Bar Chart has none. The interaction was dropped.164```165166Fix or drop what it warns about.167168## Update the chart169170A chart opens clean. `updates` add the agent's own marks to it only for one171of these reasons; without one, what the agent wants to say goes in its reply.1721731. **The user asks for marks on the chart.** They name one ("label the peak",174 "highlight Japan", "a line at $3", "shade the recession"), or describe a175 chart that has to tell its point on its own ("for a slide").1762. **The user asks about a chart already on screen.** The answer points at177 the chart: emphasise the rows, note the value, frame the range.1783. **A requested interaction needs a starting state.** "Look at one year,179 then slide along" opens on that year with `set-viewport`.1804. **A concrete question, pointed at lightly**, as below.181182### Muted annotations183184A question about particular values (a peak, a value at a date, a difference,185a crossing, a threshold, which items pass one) may point at its answer186without being asked. An overview question ("how did it move", "is there a187relationship") gets none.188189- **The title says it; the annotation points.** The answer is in the title190 (and the reply). On the chart, only what directly answers the question: one191 mark, two for a difference or a crossing, one span, or one small set.192- **A label names what it points at.** A few words that still mean something193 on their own: the value and what identifies it ("$5.01 · Jun 13, 2022",194 "China 26, Russia 23"). Not a bare tag ("Peak", "Max"), not a sentence, not195 a repeat of the title or of a value label the chart already prints.196- **Room decides the form, not the chart type.** Where there is open space197 beside the answer, a short label. Where marks fill the space round it (a198 full grid of cells, a dense cluster, a bar that already prints its value),199 the highlight alone: `annotate-text` with `text: ""` draws the ring or200 outline and no caption. Many answers (more than three or four) get emphasis201 with no labels, and the list goes in the reply.202- **Light forms.** A mark: `annotate-text` with the default `highlight:203 'light'`, or `'strong'` for an outline. A span or band: one204 `annotate-region` under the marks, low opacity, a caption only when the205 title does not give the range and the plot has room above it. A small set:206 `set-style` with `state: 'emphasized'`, `emphasis: 'light'`, or an outline207 per member. A clear cluster: one `annotate-enclosure`, no caption when the208 legend names it. A value the question names: a plain `set-overlay` rule.209- **The answer is in view.** A pointer on a mark the reader cannot see is210 nothing. On a chart that scrolls or opens zoomed (a long heatmap, a wide211 calendar), narrow the data to the stretch that holds the answer, or open212 the viewport on it.213- **Not muted:** notes that tell a story, several shaded episodes, context the214 question did not ask about, `strong` or `exclusive` emphasis. Those need an215 ask (reason 1).216217Text and paint come from the theme: notes take its annotation type, rings,218outlines and enclosures its `interaction.highlight`. Set them per update219(`value.style`, `value.highlightStyle`) only when the user asks.220221### The state222223After every build and every committed gesture, the MCP chart view sends the224agent the card's state in field terms: the chart after the reader's panel225edits, each op of your updates as applied (✓) or not and why (✗), what the226reader selected, hid or filtered, and the viewport. Read it before writing,227so an update does not undo what the reader set. The rows you were given are228the source of every value; nothing is computed that the chart cannot verify.229230### Ops231232| Op | It is for | Effect | Shape | Needs |233| --- | --- | --- | --- | --- |234| `set-style` | The marks the chart already draws: emphasize some, fade some, hide some, recolour some. A highlight is this op with `state: 'emphasized'`. | Emphasize the targets and recede the rest; recolour; fade; hide. `emphasis` sets how far the rest recede: `'light'` (default; they stay readable), `'strong'`, `'exclusive'` (only the targets read). | `{ op, targets: UpdateTarget[], value: StyleSpec }` | marks |235| `annotate-text` | One mark, a stretch of a line or area, a leg of a map route (`visual: { kind: 'path' }` on the row it leaves from), a slice or a region that should carry a note. | Set a caption beside it: plain words haloed in the page, a leader only where needed, never a card; `null` clears it. `highlight` marks what it names: `'none'`, `'light'` (default), `'strong'`, `'exclusive'` (the rest recede, so no separate `set-style` emphasis is needed). The caption takes the theme's annotation type (else the axis labels' face a size up); `style` sets one note's `fontSize`, `fontWeight` or `color`; `highlightStyle: { color, width }` its ring or outline, over the theme's `interaction.highlight`. `text: ""` draws the highlight alone (an outline or ring, no caption); with `text` omitted the chart words the note itself. For a boxed callout use `set-overlay` or `set-freeform-overlay`. `set-annotation` is its deprecated name; do not write it. | `{ op, target: UpdateTarget, value: { text, anchor?: 'segment' \| 'point', highlight?, style?: { fontSize?, fontWeight?, color? }, highlightStyle?: { color?, width? } } \| null }` | one resolved element |236| `annotate-region` | A stretch of the plot: a period, a band of values, a box, a run of categories. | Shade it, with an optional caption set on it; `null` clears it. | `{ op, name, value: { x?: [lo, hi] \| categories, y?: [lo, hi] \| categories, text?, color?, opacity?, layer?: 'under' \| 'over', placement?: 'top' \| 'bottom' \| 'left' \| 'right' \| 'center' \| 'above' \| 'below' } \| null }`; on a map `longitude: [west, east], latitude: [south, north]` in place of x and y | x or y scales, or a map (not a pie or radar) |237| `annotate-enclosure` | A group of marks that belong together: a cluster, a run of bars, a block of cells. | Outline each target group; one optional caption shared by them, with leaders to two or three outlines; `null` clears it. | `{ op, name, value: { targets: UpdateTarget[], text?, shape?: 'hull' \| 'rect' \| 'ellipse' \| 'circle', connect?: 'auto' \| 'all' \| 'none', color?, width? } \| null }` | marks |238| `set-viewport` | The range or region the chart should frame. | Frame a continuous domain. | `{ op, axes: 'x' \| 'y' \| 'xy', value: { x?: [lo, hi], y?: [lo, hi] } }`; on a multi-level map `value: { region: { key } }` | `navigate` or `brush-zoom` mounted on that axis |239| `set-order` | The order of the categories on a discrete axis. | Reorder the axis; list every category in the order wanted. | `{ op, scope: 'category', field, values: unknown[] }` | `drag-reorder` mounted on that axis |240| `set-overlay` | Marks the chart does not draw: a reference line, a threshold band, a forecast, a sketch of rows. | Draw new rows through the plot's own scales. | `{ op, name, value: { mark, data: { values }, encodings: { x?, y?, x2?, y2?, order?, color?, text? }, role, interactive?, projectable?, style? } \| null }`; on a map `longitude`, `latitude` (and `longitude2`, `latitude2` for a rule or rect) in place of x and y | x and y scales, or a map |241| `set-freeform-overlay` | A custom shape with no data behind it. | Draw SVG, or a clone of marks, over the plot. | `{ op, name, value: { coordinateSpace: 'plot' \| 'renderer', body: [{ type: 'svg', content } \| { type: 'clone', targets, transform?, opacity? }] } \| null }` | — |242| `set-data` | The rows the chart draws, for playback or a swap. | Replace every row; the rows carry every encoded field. | `{ op, source: 'main', value: { rows } }` | inline data |243244`StyleSpec` is `{ state?, emphasis?, opacity?, visible?, fill?, stroke?,245strokeWidth?, mutedOpacity? }`. Two states matter from outside: `emphasized`246keeps the targets at full ink and recedes every other mark by `emphasis`247(`'light'` by default, `'strong'`, `'exclusive'`; `mutedOpacity` sets the level248outright); `normal` with `targets: []` clears the layer. `opacity` on the249targets fades a subset and leaves the rest alone; `opacity: 0` hides marks and250keeps the axes, where `visible: false` removes the rows and shrinks the scales.251252Overlay marks are `line`, `point`, `rule`, `rect`, `text`. `encodings` name253fields of the overlay's own rows, projected through the chart's x, y, and254colour scales. `style` takes `stroke`, `strokeWidth`, `strokeDash` (lengths, or255`'dash'` / `'dot'`), `fill`,256`fillOpacity`, `opacity`, `pointRadius`, `fontSize`, `fontWeight`, `fontStyle` (`italic`), `textAlign`257(`start`, `middle`, `end`), `dx`, `dy`. A `line` takes its stroke and a `text`258its fill from the `color` encoding; a `point` takes `style.fill`. A `text` sits on259the data, so it draws a halo in the chart's background; `stroke` sets another260colour, `strokeWidth` its width, and `stroke: 'none'` drops it, as a faint261watermark wants.262263Two ops need a preset the chart mounts: `set-viewport` needs `navigate` or264`brush-zoom` on that axis, `set-order` needs `drag-reorder`. The host says265which are mounted, or the state shows `viewport` and `categoryOrder`. On a266chart that mounts neither, say so and offer an emphasis; `set-data` replaces267what the chart shows and is not a frame. Legend values belong to268`legend-toggle`: no update hides or restores one, and a series fades with269`opacity` instead.270271### Targets and values272273A target is one of three forms:274275```ts276{ select: { key: { Country: 'Japan' } } } // marks with these values277{ select: { where: { Region: { in: ['Asia', 'Europe'] }, Month: { range: ['2025-03', '2025-06'] } } } } // a set of marks278{ visual: { kind: 'mark', role: 'mark' }, elements } // elements from an event or the state279```280281- A `where` describes a set, in the words filters use: each field `in` a list282 or within a `range` (ends included; `null` leaves an end open), and every283 field must hold. Use it for a period, a band of values, or several categories284 at once, where a key would need one target per row. `set-style` and an285 enclosure's targets take a `where`; a note or an order names one mark, so it286 takes a key.287- Use the annotation ops to put a message on the chart: a note288 (`annotate-text`) on a mark, a shaded region (`annotate-region`) over a289 stretch of the plot (two bounds on a continuous axis, `null` for the plot's290 end, or adjacent categories on a banded one), or an outline291 (`annotate-enclosure`) round a group of marks, each with optional text.292 Leave colour, shape and placement to the chart unless the request names293 them. A note marks its own target through `highlight`; do not pair it with294 a `set-style` emphasis to make the mark stand out. A stretch of a line or295 area that spans a period is a region, not a note on one segment.296297- A selector key names fields the chart encodes (`x`, `y`, `color`, `detail`,298 `size`, …) and matches rows by equality, so `'2007'` and `2007` differ. One299 key may cover many marks (`{ Continent: 'Africa' }` takes every African300 mark); several fields narrow it; an annotation's key covers one. On a line301 or area chart, a key on the series field covers the whole line and a key on302 the x field covers the segment that starts at that row, so a run of segments303 is one target per row. The last row of a line starts no segment; its key304 takes the segment that ends there. A note on an x key marks the segment, for305 a change from one row to the next ("2019 → 2020: +4%"); `anchor: "point"`306 marks the row's own point, for its value ("Dec 2022: $0.87B"). A note on307 the last row is always at its point.308- Annotation text says what the chart does not ("Promotion launched", "Lowest309 in Q3"), not a value or label it already prints (`note_repeats_chart`). The310 title states the finding; a note puts its specifics on the mark, and names311 the mark where the chart does not (a dot on a scatter).312- A field the chart does not encode resolves to nothing. Encode the identity313 field (`detail` on a scatter), or pass elements from `event.target`,314 `state.selected`, or `context.available` through as `{ visual, elements }`,315 as they are: an element's `value` carries derived fields on a bar, pie,316 heatmap, or waterfall mark (a stack start, a sort index), so the element317 resolves where a key copied from it does not.318- A target that matches nothing is listed in the result as unresolved, and319 nothing nearby is taken in its place.320321A key value, an overlay row, and a viewport bound hold what the parsed row322holds: a CSV `120` is the number `120`. A temporal field (`Year`,323`YearMonth`, `Date`, …) takes a date written the way the data writes it324(`"2014-01"`, `2014` on a `Year` field) or UTC epoch milliseconds. On a325discrete axis the value is the category. Overlay rows need the fields their326mark reads: `line`, `point`, `text` read `x` and `y`. A `rule` with only `x`327is a vertical line across the plot, and one with only `y` a horizontal328threshold; a `rect` with only `x` and `x2` is a full-height band, and one with329only `y` and `y2` a full-width band. With all four channels, `rule` and `rect`330run from (`x`, `y`) to (`x2`, `y2`). An overlay whose rows do not project is331reported as unsupported.332333```json334{ "id": "agent", "ops": [335 { "op": "set-style", "value": { "state": "emphasized" },336 "targets": [{ "select": { "key": { "month": "2014-01" } } }, { "select": { "key": { "month": "2014-02" } } }] },337 { "op": "set-overlay", "name": "threshold", "value": { "mark": "rule", "role": "reference",338 "data": { "values": [{ "y": 1e9 }] }, "encodings": { "y": { "field": "y" } } } },339 { "op": "set-overlay", "name": "period", "value": { "mark": "rect", "role": "band",340 "data": { "values": [{ "start": "2022-11", "end": "2026-08" }] },341 "encodings": { "x": { "field": "start" }, "x2": { "field": "end" } }, "style": { "fillOpacity": 0.12 } } }342] }343```344345### Layers346347**Ids are layers.** One id holds one concern: the agent's update, a story348step, a linked selection. Use one stable id, such as `agent`, and send the349whole layer each time:350351- An update with an id already retained replaces that layer, and carries only352 what it lists: an omitted viewport flies home, an omitted order returns to353 the input order, an omitted annotation disappears. The ops that should hold354 are repeated; the ops the request replaces are dropped.355- Layers compose in insertion order, and a replaced layer keeps its place:356 styles accumulate across layers; for an annotation, an order, a data swap,357 or an overlay name, the layer inserted last wins. One kind of op lives in358 one layer: a drag and a playback that both swap the rows write the same id.359- A canvas interaction retains its layer under its own `id`; a host may write360 or clear that layer by the id, as a Reset button does.361- A gesture reset (`click-none`, `escape`, `double-click`) clears preset362 layers only. A host layer stays until the host clears it, or until a layer363 with `set-style`, `targets: []`, `state: 'normal'` replaces it.364- After `set-data` the marks are new; a style layer is sent again with the365 data.366367### Send it368369Pass the layers as `updates`, a key of the chart input beside `data` and370`chart_spec` (not inside `chart_spec`), to `show` as part of `chart`, or to371`validate_chart` for the report without a card:372373```json374{375 "data": { "values": [ ... ] },376 "chart_spec": { "chartType": "Bar Chart", "encodings": { "x": "region", "y": "revenue" } },377 "updates": [378 { "id": "agent", "ops": [379 { "op": "set-style", "targets": [{ "select": { "key": { "region": "East" } } }], "value": { "state": "emphasized" } },380 { "op": "annotate-text", "target": { "select": { "key": { "region": "West" } } }, "value": { "text": "Lowest in Q3" } }381 ] }382 ]383}384```385386`show` opens the chart with the layers applied, with the same look as a387user action. To show the chart in a new state, call `show` again with the same388input and the layers wanted now. Each `show` opens a new card with389exactly those layers; earlier cards keep what they showed. The argument is state, and `interaction_spec` is behaviour, so390each stays where it is. The reader's own brush or selection does not survive391the new view; the context message reports it in field terms, and it is392carried as a layer when it still serves the reader.393394A malformed layer or an invalid spec is an error, and `show` draws nothing395for it. Otherwise the report lists each op that will not apply, and why, led396by a count. The chart draws without a ✗ op: fix it in the layer (a key no row has,397an overlay encoding written as `"x": "start"` instead of `{ "field": "start" }`,398a viewport with no navigation preset) before you call `show`, or tell the399reader what is missing. The400reader's later brushes and clicks reach you with their next message, not in401the same turn.402403## Worked examples404405In each example `data` is a placeholder; the host binds real rows.406407### Presets: a named gesture408409User: "An interactive chart that I can brush." A line chart of `sales` by410`month`, one series.411412```json413{ "interactions": [ { "type": "brush-x" } ] }414```415416The user named one job, a brush along the period axis, and the row for it is417`brush-x`. Hover already reads the values.418419### Presets: a goal on a category chart420421User: "Which regions stand out? Let me look." A bar chart of `revenue` by422`region`, no colour field.423424The reader singles out a region and compares orders. `click-highlight` singles425one out; `drag-reorder` lets the reader rank by hand. No colour field is426bound, so `legend-toggle` has nothing to work with. Both presets ask for a427different trigger, a click on a bar and a drag on an axis label.428429```json430{431 "interactions": [432 { "type": "click-highlight" },433 { "type": "drag-reorder" }434 ]435}436```437438### Presets: comparing a few series439440User: "Make this interactive so I can compare the three regions month by441month." A line chart of `sales` by `month`, `color: region`.442443The user asks for behaviour and names the job: comparing the series at one444month. `inspect-index` reads all three at the month under the pointer, which445the tooltip (one line at a time) does not. Nothing else was asked for.446447```json448{ "interactions": [ { "type": "inspect-index" } ] }449```450451### ChartUpdate: an agent points out rows452453User: "Which Asian countries are past 80 years? Point them out." The chart on454screen is a scatter of `gdp` by `life` with `color: continent`,455`detail: country` and `navigate` on `y`, and the state says nothing is456emphasized. The agent finds Japan and Singapore in its rows and answers:457458```json459{460 "id": "agent",461 "ops": [462 { "op": "set-style",463 "targets": [464 { "select": { "key": { "country": "Japan" } } },465 { "select": { "key": { "country": "Singapore" } } }466 ],467 "value": { "state": "emphasized" } },468 { "op": "annotate-text",469 "target": { "select": { "key": { "country": "Japan" } } },470 "value": { "text": "Japan, 82.6 years" } },471 { "op": "set-viewport", "axes": "y", "value": { "y": [70, 86] } }472 ]473}474```475476`country` resolves because it is encoded on `detail`. The result returns477`applied` with two resolved targets; a key with `"Country"` would come back478unresolved, and the agent fixes the spelling before it describes the chart.479480## Validation checklist481482For an `interaction_spec`:4834841. It parses as strict JSON and is a bare object with `interactions`.4852. Every entry has a reason (the user asked, the chart is linked, or the data486 needs it to be read) and a job the tooltip and legend do not do.4873. Every `type` is in the chart type's list from `list_chart_types`, and every488 option is under `options` with `id` on the entry.4894. `groupBy` and `seriesBy` are present where required, and name bound fields.4905. At most one entry owns the plot drag, the double-click, the legend click,491 and the retained mark focus.4926. The report notes no dropped or yielded entry.493494For `updates` or a `ChartUpdate`:4954961. Every `op` and `state` is one from the op table.4972. Every selector key names encoded fields with values that exist in the rows.4983. The update is the whole layer for its id; clearing uses `targets: []` with499 `state: 'normal'`.5004. Ops that need a mounted preset have it, or `unsupportedOps` has been read501 and acted on.5025. The result came back `applied` before you said what the chart shows.503504## Preset options505506`list_interaction_presets` returns every preset with what it needs from the507chart, its reset gestures, and every option it accepts under `options`, with508each option's type and note; `type` narrows it to one preset and `chartType`509to the presets a chart type supports. In code, the same options are the510factory's parameter type in `flint-chart/interactive`. `id` is never an511option: it sits on the entry. A `ResetGesture` is `click-none`,512`double-click`, or `escape`. `dimOpacity` is the opacity of the muted marks,5130.25 by default. A `guide` is `{ visible?, style? }`, or `false` to draw514nothing while the gesture runs.515