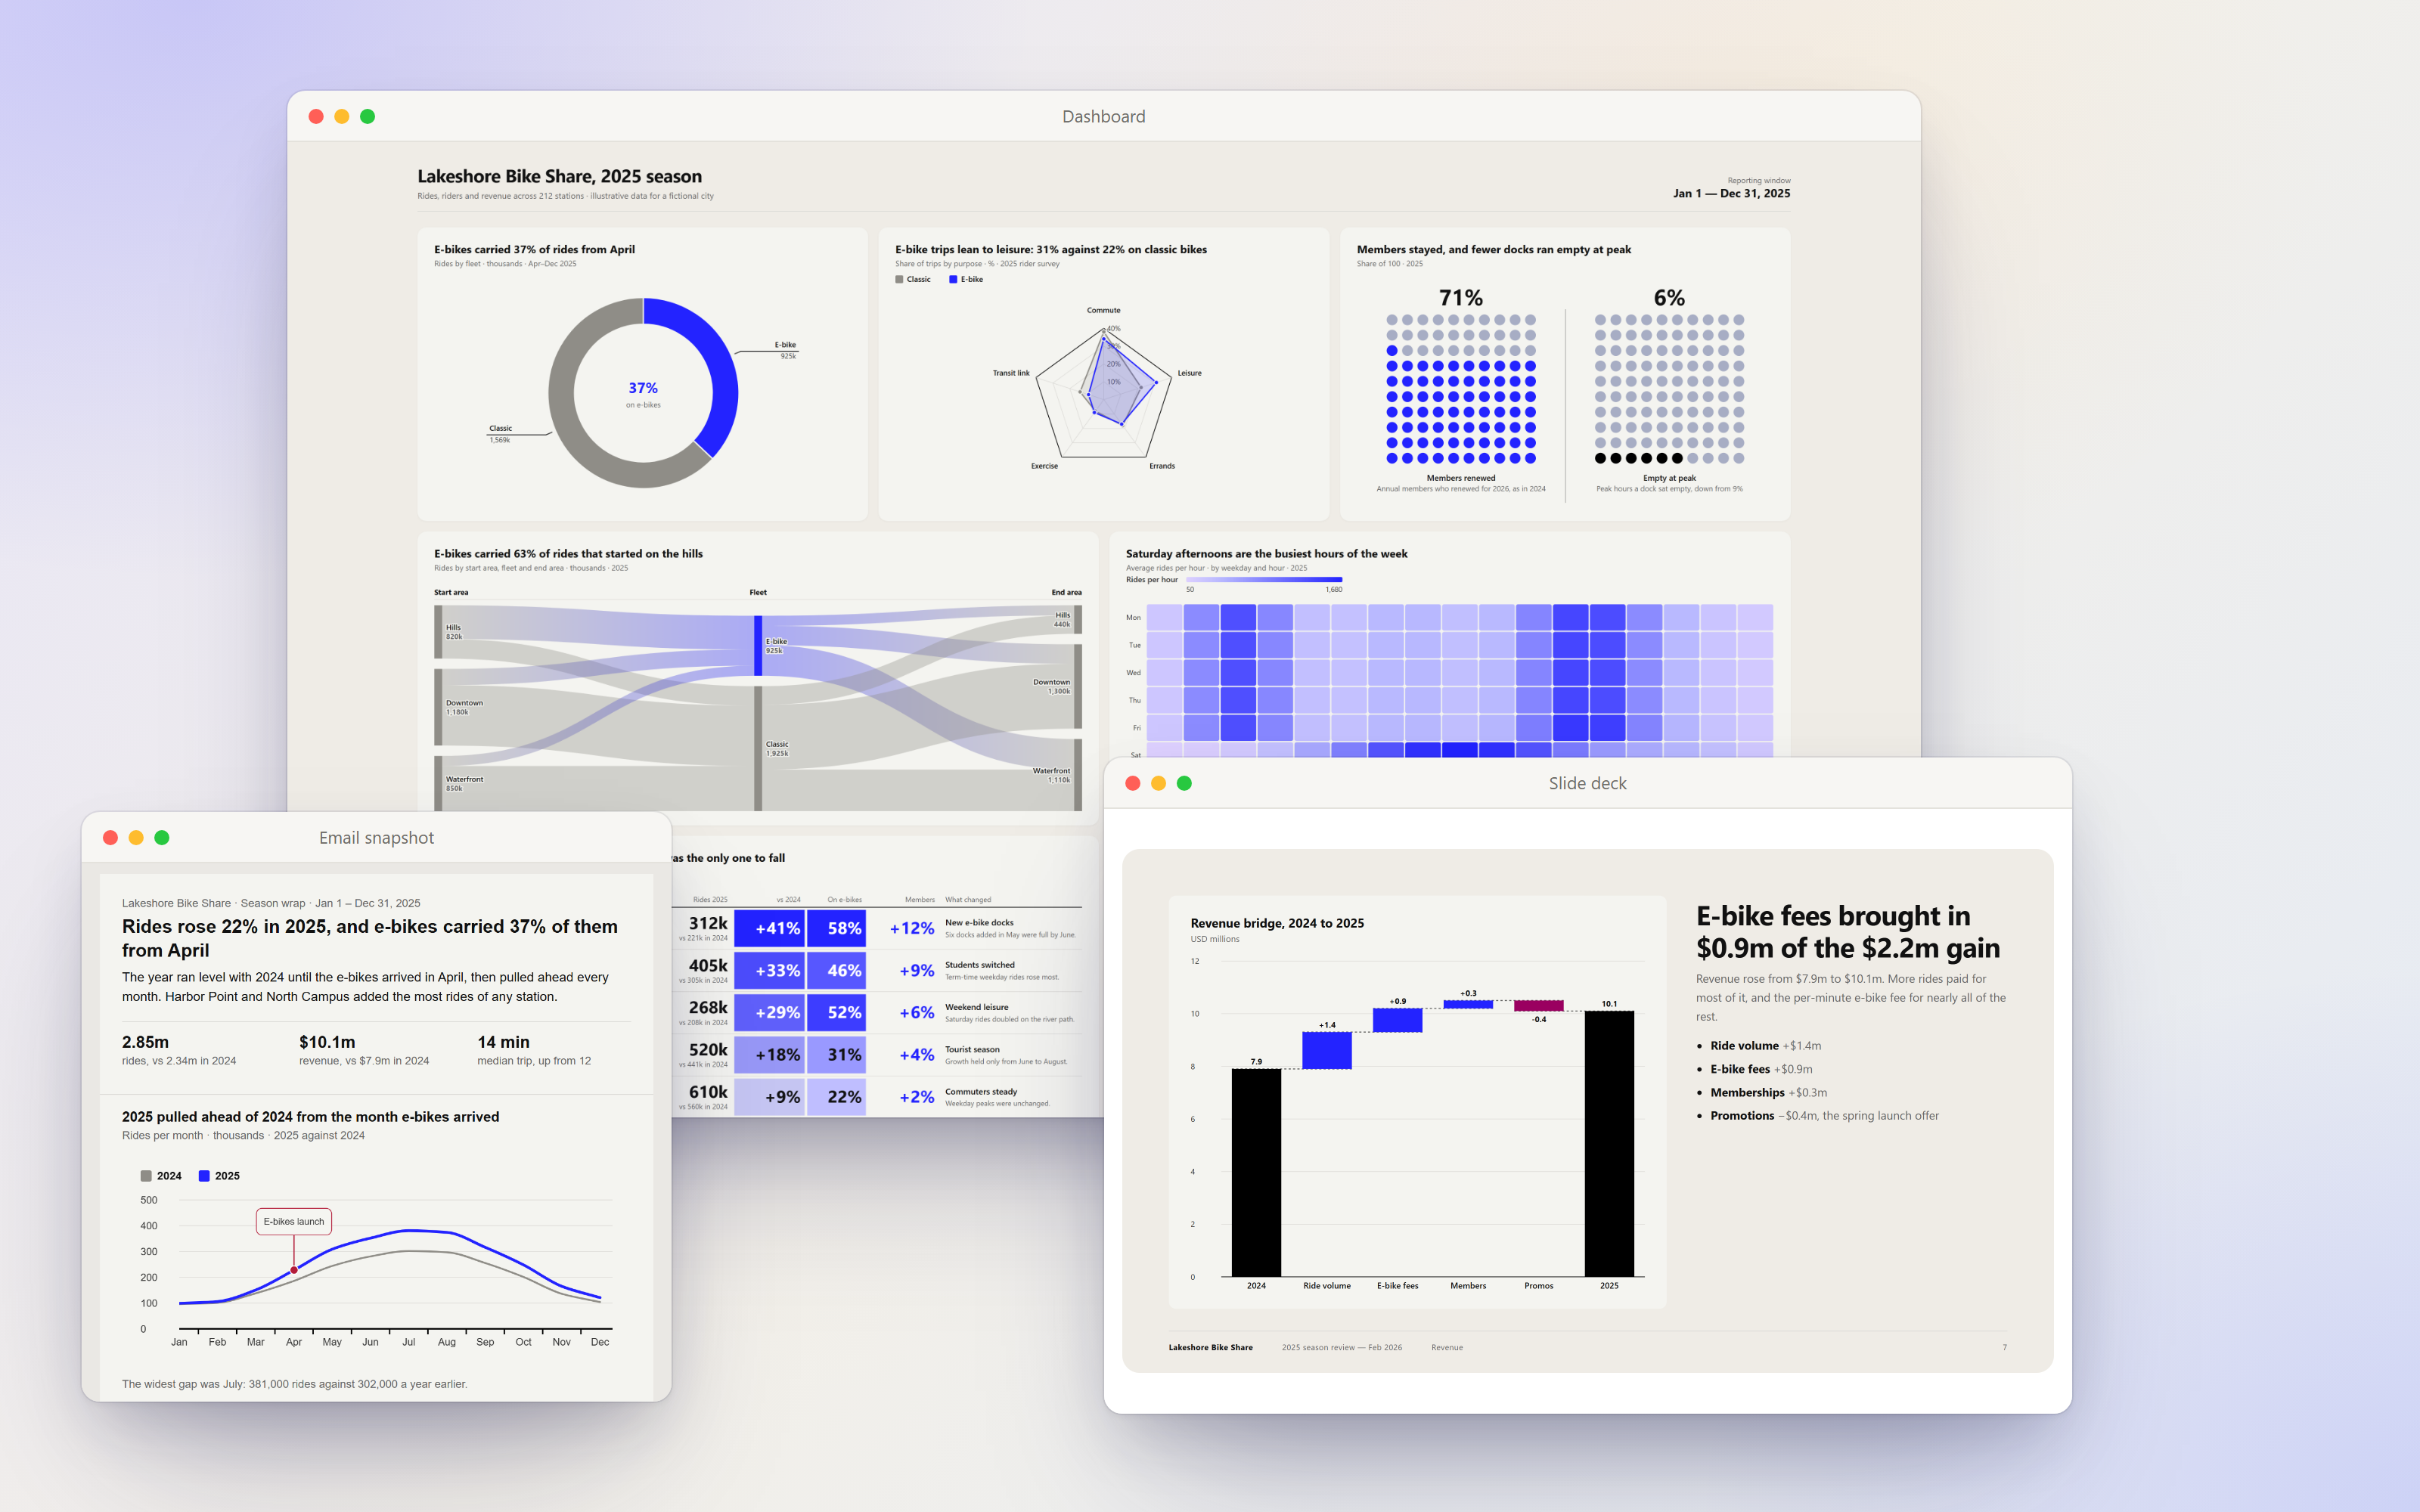
Social post
Turn the numbers the user gives into a post for a public feed: one to three
cards, each one finding with one chart, painted into a picture at the size
the platform asks for, and the words to post with them, one version per
platform the user named. The output is one self-contained HTML page. The user
opens it, copies each picture and each post, and publishes them themselves.
<skill-dir> below is the directory holding this file
(${CLAUDE_SKILL_DIR} where the agent expands it). Resolve templates/,
references/, scripts/ and assets/ against it, never against the working
directory.
This file is the route; the detail lives in references/, and each step says
which file to read and when.
Rules that hold on every post
- Never invent numbers that read as real measurements. A topic with no
data gets figures labelled illustrative on the card and in the post.
A missing value is a gap (
null), never a zero. A modelled value never
joins a measured line as another point.
- The picture carries everything. It gets reposted without its words, so
the finding, units, source and date are painted into the card.
- One finding per card, at most one chart, one to three cards. More
findings than that are a page, not a post: pick the ones that lead and say
which you left out.
- Every figure in a post is on a card. No number in the words that the
pictures don't show, and no cause the user didn't state: not in the post,
not on the card, and not in the chat as a caveat or a sample reason.
- The headline states the finding with its number, and its arithmetic is
checked first. "Doubled", "half", "the biggest" are claims: compute them
before writing them.
- Nothing invented around the data. No handle, logo, link or hashtag the
user didn't give; no engagement bait; no emoji decoration.
- One standalone file. No CDN, no
<script src> or <link href>, no
webfont. scripts/finalize.js inlines the library and its exit code is the
gate (step 8).
- Never post. No tool here opens a platform. Don't offer to post,
schedule or reach a platform's API; the user publishes it.
Workflow
Extract the data and find the findings. Pull every number, category and
period out of the user's input. List the findings it holds, each as one
sentence with its number, and note for each: the data shape, the values it
needs, and how many values run across it. If the user gave a topic with no
numbers, say plainly that the figures will be illustrative (rule 1). If they
named no platform, build LinkedIn and X, and say so at handover.
Pick the one to three findings to post. The one the user asked about
leads; then the largest change. Read references/headlines.md, and write
each headline: the finding, with its number, arithmetic checked (rule 5).
Under 95 characters (80 on a landscape card). No finding with a number in
it means nothing to post yet: say so and ask what the post should show.
Copy the template. <skill-dir>/templates/social.html to ./post.html
(or where the user asked). Leave its four charts-lib/… tags exactly as
written: they are placeholders that step 8 folds in. Don't copy
assets/charts-lib/ beside it.
Static unless asked. Build an editable post (charts as JSON, an
Edit page button) only when the user asked; read
references/editable.md first and start from social-editable.html.
Compose the cards and the words. Read references/cards-and-posts.md:
card sizes, the five parts of a card (kicker, headline, units line, chart,
source with a date), chart room per size, the platforms' limits and folds,
and the rules for the words. portrait is the default size; landscape
for an X- or Bluesky-only post with a simple chart.
Choose each card's chart, then write its config against the API. Read
references/card-charts.md (which chart fits a card, emphasis, labels;
it points into references/chart-selection.md for the input contract and
the emphasis code), then references/chart-api.md and only the references/charts/<type>.md
files for the types you use, in one read. Never guess an option name.
Draw every chart through SocialSnapshot.draw(Charts.<type>, 'id', config),
with no title or subtitle in the config, and give it a data-alt that
states the finding with its numbers. When a card marks a forecast, a
target or an event, read references/annotation.md.
If the user pointed at a brand (site, stylesheet, hex codes), recolour
and change nothing else. Read references/theming.md, then run
node <skill-dir>/scripts/generate-theme.js '#2323FF' (or
extract-theme.js on their stylesheet), and apply its one
Charts.applyPalette call before the first chart. A logo goes on a card
only if they supplied the file.
Verify before reporting done. Read references/verify-and-ship.md and
follow it. In short: node <skill-dir>/scripts/finalize.js post.html --stage; node <skill-dir>/scripts/check-page.js post.html and fix what it
reports; in a browser at 1440x900, JSON.stringify(await SocialSnapshot.freeze()) until ok is true; one screenshot of the cards;
then re-read every figure against the data. Without a browser, say the
pictures weren't checked in one.
Fold the library in and ship one file:
node <skill-dir>/scripts/finalize.js post.html. A non-zero exit means you
are not done. If Node may be missing, run sh <skill-dir>/scripts/finalize.sh
(or scripts/finalize.ps1 on Windows) with the same arguments; it prints
UNCHECKED when it could not run the checks, and you say so.
Output
One HTML file, standalone. Surface it however your environment does (in
Claude Code: SendUserFile with display: "render"), otherwise print its
absolute path. Then, in chat:
- How to use it: open it in Edge or Chrome; per card Copy picture,
Save PNG, Copy alt text; per platform Copy text. Paste the text,
then the picture, then the alt text into the picture's description field.
- Nothing was posted, and the post itself wasn't tried on the platform.
- The handover with handles: each card's size, headline and figures, each
post's length against its limit and the figures it carries, which figures
came from their data and which were illustrative, and the closing line
(
references/tracing.md § Handles and the closing line). Handles are for
the chat only: never on a card or in a post.
Worked handover:
post.html — 1 card, 2 posts. Open in Edge or Chrome; nothing was posted.

C1 · portrait · "Sign-ups doubled in six weeks, from 310 to 640"
     C1.1 310 (week 1) · C1.2 640 (week 6) · C1.3 doubled (640 ÷ 310 = 2.06×)
LinkedIn · 412 / 3,000 · figures 310, 640 (both C1)
X · 214 / 280 · figures 310, 640 (both C1)
From your data: every figure. Illustrative: none.

Ask "where does C1.3 come from?" or "why is that C1's headline?" to see the working behind any figure.
On the first post in a conversation, if the user didn't ask for an editable
one, offer it once in one line before the handover: "Want an editable version,
so you can change the wording or the numbers yourself without rerunning this?"
An editable post ships as two files, <name>.html (final, to share) and
<name> (working copy).html (editable); say which is which.
Tracing
A post puts a figure in public under the user's name, so every figure must be
answerable from their data in one turn. Read references/tracing.md before
answering any follow-up. It carries the handles (C1…C3, C1.1, platform
names), the fixed closing line, the trace block (From your data · Working ·
Where it appears · What would change it), the headline block, and the
questions to expect: "where does C1.3 come from?", "why is that the
headline?", "can we say doubled?", "it's 25%, not 23%", "round it up",
"put the 40% in the X post", and "add a line on why it went up". That last
one gets only a cause the user stated, in their words.
A trace re-reads the data and corrects the post when it's wrong: the card
and every post carrying the figure, then steps 7–8 again. Pushback alone moves
nothing.
Environment notes
Nothing here needs a specific agent or vendor: file reads from this directory,
writing an HTML file, and Node for finalize.js and the checks. A browser is
used for the freeze check and the screenshot when one is available. The
pictures are painted by the browser that opens the file: Edge and Chrome paint
them, Safari refuses, and the page says so.
1---2name: social-post3description: "Turn data the user supplies (a table, CSV, pasted numbers, metrics, notes) into a social media post with a chart — one to three chart cards painted as pictures at each platform's size (1080x1350, 1080x1080, 1200x675) with the headline, units, source and date in the picture, plus the words to post, one version per platform within its character limit. Use whenever the user wants to post a chart or a finding on LinkedIn, X/Twitter, Bluesky, Threads, Mastodon or Instagram, \"a tweet with the chart\", \"something for our socials\", or a data post for a feed. Posts only: not dashboards, reports, decks, email or chat messages. Writes one standalone HTML file with Copy picture, Save PNG, Copy alt text and Copy text buttons; never posts, schedules or invents a handle or link."4metadata:5 source: https://skillmd.com/skills/raghuramsirigiri/social-post6---78# Social post910Turn the numbers the user gives into a post for a public feed: one to three11**cards**, each one finding with one chart, painted into a picture at the size12the platform asks for, and the **words** to post with them, one version per13platform the user named. The output is one self-contained HTML page. The user14opens it, copies each picture and each post, and publishes them themselves.1516`<skill-dir>` below is the directory holding this file17(`${CLAUDE_SKILL_DIR}` where the agent expands it). Resolve `templates/`,18`references/`, `scripts/` and `assets/` against it, never against the working19directory.2021This file is the route; the detail lives in `references/`, and each step says22which file to read and when.2324## Rules that hold on every post25261. **Never invent numbers that read as real measurements.** A topic with no27 data gets figures labelled *illustrative* on the card **and** in the post.28 A missing value is a gap (`null`), never a zero. A modelled value never29 joins a measured line as another point.302. **The picture carries everything.** It gets reposted without its words, so31 the finding, units, source and date are painted into the card.323. **One finding per card, at most one chart, one to three cards.** More33 findings than that are a page, not a post: pick the ones that lead and say34 which you left out.354. **Every figure in a post is on a card.** No number in the words that the36 pictures don't show, and no cause the user didn't state: not in the post,37 not on the card, and not in the chat as a caveat or a sample reason.385. **The headline states the finding with its number, and its arithmetic is39 checked first.** "Doubled", "half", "the biggest" are claims: compute them40 before writing them.416. **Nothing invented around the data.** No handle, logo, link or hashtag the42 user didn't give; no engagement bait; no emoji decoration.437. **One standalone file.** No CDN, no `<script src>` or `<link href>`, no44 webfont. `scripts/finalize.js` inlines the library and its exit code is the45 gate (step 8).468. **Never post.** No tool here opens a platform. Don't offer to post,47 schedule or reach a platform's API; the user publishes it.4849## Workflow50511. **Extract the data and find the findings.** Pull every number, category and52 period out of the user's input. List the findings it holds, each as one53 sentence with its number, and note for each: the data shape, the values it54 needs, and how many values run across it. If the user gave a topic with no55 numbers, say plainly that the figures will be illustrative (rule 1). If they56 named no platform, build LinkedIn and X, and say so at handover.57582. **Pick the one to three findings to post.** The one the user asked about59 leads; then the largest change. Read `references/headlines.md`, and write60 each headline: the finding, with its number, arithmetic checked (rule 5).61 Under ~95 characters (~80 on a landscape card). No finding with a number in62 it means nothing to post yet: say so and ask what the post should show.63643. **Copy the template.** `<skill-dir>/templates/social.html` to `./post.html`65 (or where the user asked). Leave its four `charts-lib/…` tags exactly as66 written: they are placeholders that step 8 folds in. Don't copy67 `assets/charts-lib/` beside it.6869 **Static unless asked.** Build an *editable* post (charts as JSON, an70 **Edit page** button) only when the user asked; read71 `references/editable.md` first and start from `social-editable.html`.72734. **Compose the cards and the words.** Read `references/cards-and-posts.md`:74 card sizes, the five parts of a card (kicker, headline, units line, chart,75 source with a date), chart room per size, the platforms' limits and folds,76 and the rules for the words. `portrait` is the default size; `landscape`77 for an X- or Bluesky-only post with a simple chart.78795. **Choose each card's chart, then write its config against the API.** Read80 `references/card-charts.md` (which chart fits a card, emphasis, labels;81 it points into `references/chart-selection.md` for the input contract and82 the emphasis code), then `references/chart-api.md` and only the `references/charts/<type>.md`83 files for the types you use, in one read. Never guess an option name.84 Draw every chart through `SocialSnapshot.draw(Charts.<type>, 'id', config)`,85 with no title or subtitle in the config, and give it a `data-alt` that86 states the finding with its numbers. When a card marks a forecast, a87 target or an event, read `references/annotation.md`.88896. **If the user pointed at a brand** (site, stylesheet, hex codes), recolour90 and change nothing else. Read `references/theming.md`, then run91 `node <skill-dir>/scripts/generate-theme.js '#2323FF'` (or92 `extract-theme.js` on their stylesheet), and apply its one93 `Charts.applyPalette` call before the first chart. A logo goes on a card94 only if they supplied the file.95967. **Verify before reporting done.** Read `references/verify-and-ship.md` and97 follow it. In short: `node <skill-dir>/scripts/finalize.js post.html98 --stage`; `node <skill-dir>/scripts/check-page.js post.html` and fix what it99 reports; in a browser at 1440x900, `JSON.stringify(await100 SocialSnapshot.freeze())` until `ok` is true; one screenshot of the cards;101 then re-read every figure against the data. Without a browser, say the102 pictures weren't checked in one.1031048. **Fold the library in and ship one file:**105 `node <skill-dir>/scripts/finalize.js post.html`. A non-zero exit means you106 are not done. If Node may be missing, run `sh <skill-dir>/scripts/finalize.sh`107 (or `scripts/finalize.ps1` on Windows) with the same arguments; it prints108 `UNCHECKED` when it could not run the checks, and you say so.109110## Output111112One HTML file, standalone. Surface it however your environment does (in113Claude Code: `SendUserFile` with `display: "render"`), otherwise print its114absolute path. Then, in chat:115116- How to use it: open it in Edge or Chrome; per card **Copy picture**,117 **Save PNG**, **Copy alt text**; per platform **Copy text**. Paste the text,118 then the picture, then the alt text into the picture's description field.119- Nothing was posted, and the post itself wasn't tried on the platform.120- The handover with handles: each card's size, headline and figures, each121 post's length against its limit and the figures it carries, which figures122 came from their data and which were illustrative, and the closing line123 (`references/tracing.md` § Handles and the closing line). Handles are for124 the chat only: never on a card or in a post.125126Worked handover:127128```129post.html — 1 card, 2 posts. Open in Edge or Chrome; nothing was posted.130131C1 · portrait · "Sign-ups doubled in six weeks, from 310 to 640"132 C1.1 310 (week 1) · C1.2 640 (week 6) · C1.3 doubled (640 ÷ 310 = 2.06×)133LinkedIn · 412 / 3,000 · figures 310, 640 (both C1)134X · 214 / 280 · figures 310, 640 (both C1)135From your data: every figure. Illustrative: none.136137Ask "where does C1.3 come from?" or "why is that C1's headline?" to see the working behind any figure.138```139140On the **first** post in a conversation, if the user didn't ask for an editable141one, offer it once in one line before the handover: *"Want an editable version,142so you can change the wording or the numbers yourself without rerunning this?"*143An editable post ships as two files, `<name>.html` (final, to share) and144`<name> (working copy).html` (editable); say which is which.145146## Tracing147148A post puts a figure in public under the user's name, so every figure must be149answerable from their data in one turn. Read `references/tracing.md` before150answering any follow-up. It carries the handles (`C1…C3`, `C1.1`, platform151names), the fixed closing line, the trace block (*From your data · Working ·152Where it appears · What would change it*), the headline block, and the153questions to expect: *"where does C1.3 come from?"*, *"why is that the154headline?"*, *"can we say doubled?"*, *"it's 25%, not 23%"*, *"round it up"*,155*"put the 40% in the X post"*, and *"add a line on why it went up"*. That last156one gets only a cause the user stated, in their words.157158A trace re-reads the data and **corrects the post** when it's wrong: the card159and every post carrying the figure, then steps 7–8 again. Pushback alone moves160nothing.161162## Environment notes163164Nothing here needs a specific agent or vendor: file reads from this directory,165writing an HTML file, and Node for `finalize.js` and the checks. A browser is166used for the freeze check and the screenshot when one is available. The167pictures are painted by the browser that opens the file: Edge and Chrome paint168them, Safari refuses, and the page says so.