
Human Protein Atlas Database Visualize
Overview
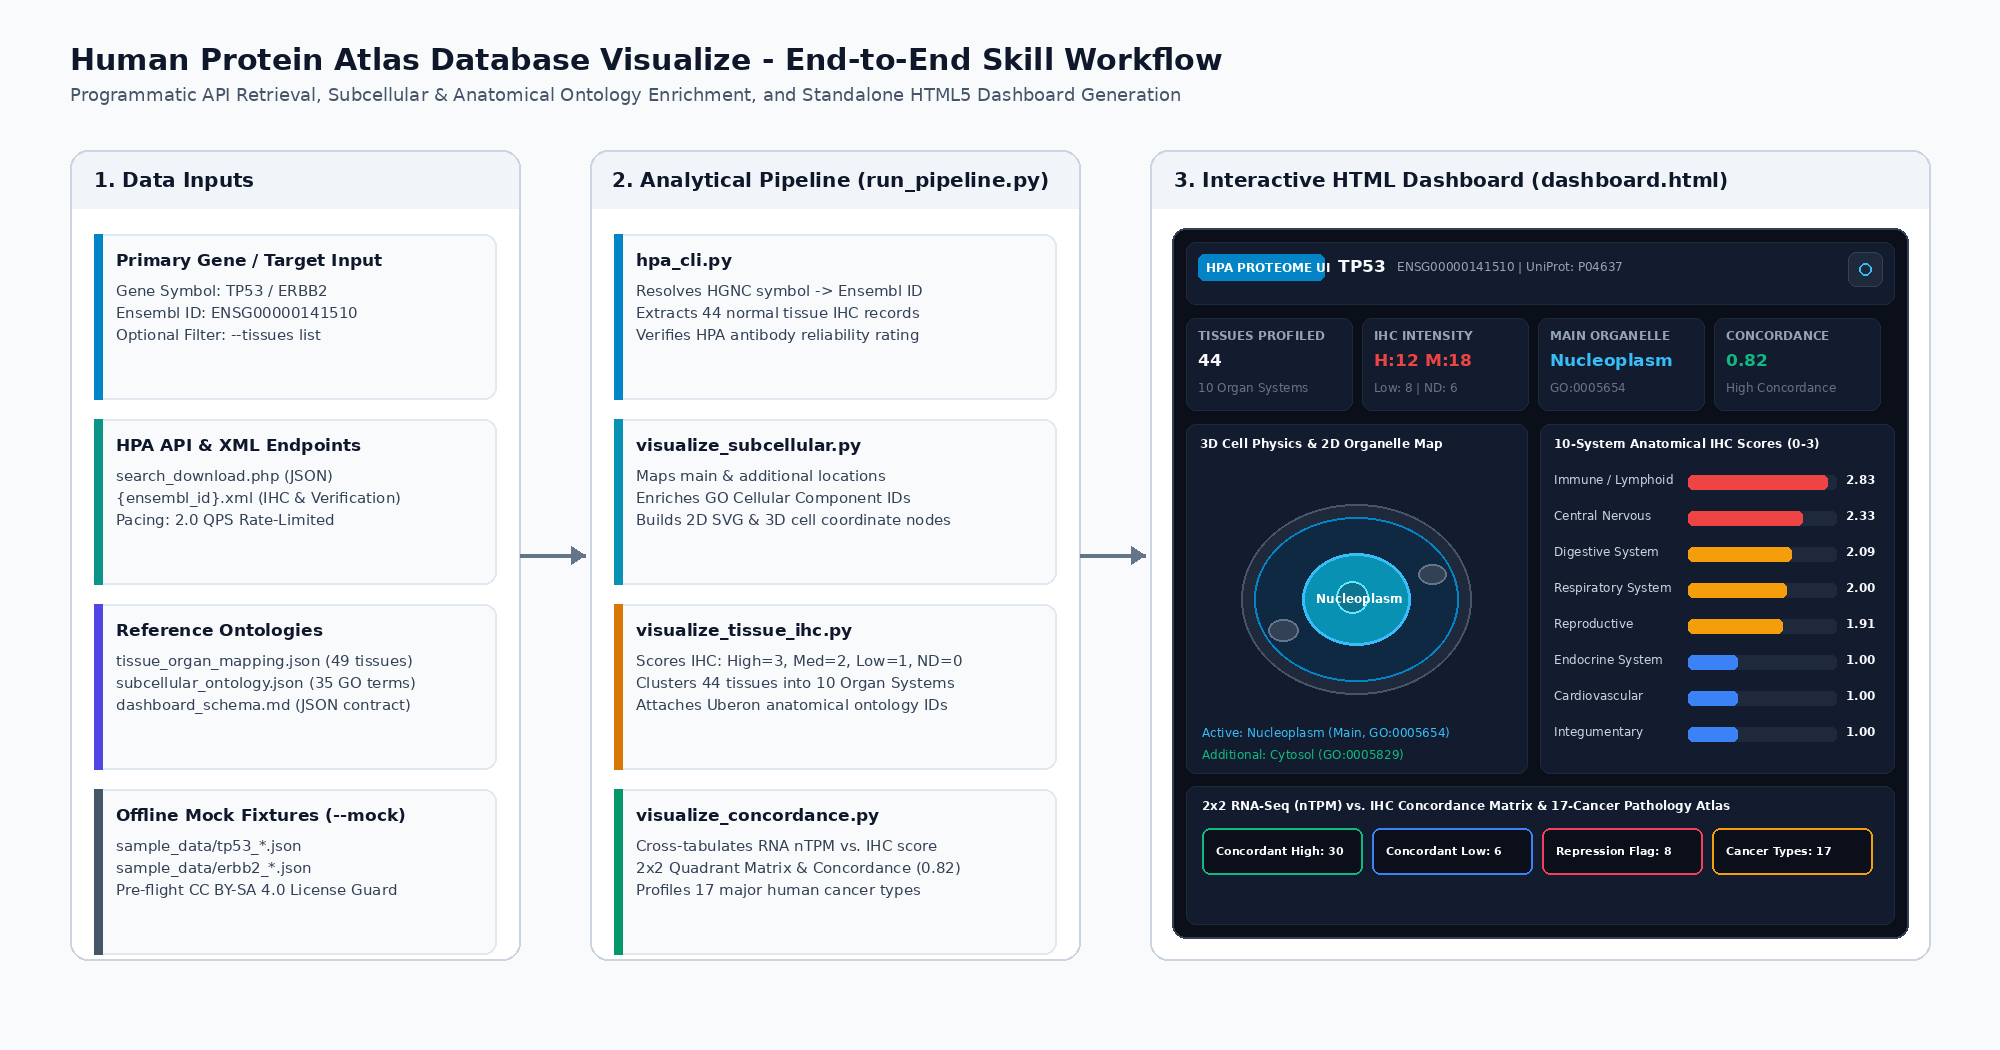
This skill provides programmatic queries, spatial subcellular localization mapping, anatomical IHC scoring, and interactive standalone HTML5 dashboards using data from the Human Protein Atlas (HPA). It combines semi-quantitative IHC protein abundance across 44+ normal human tissues with confocal microscopy-based subcellular organelle localization, RNA-protein concordance metrics, and hybrid 3D physics + 2D vector visualizations.
Prerequisites
- Python Environment: Python >= 3.10 with
polite-http(or standard library fallback). - License Guard: Verify that
.licenses/human_protein_atlas_database_visualize_LICENSE.txtexists in the workspace root. If absent, display the licensing notice and create the file with an ISO timestamp before querying.
Core Rules
- Execute Utility Scripts: Always invoke the provided Python scripts in
scripts/. Never execute un-rate-limited HTTP requests directly againstproteinatlas.org. - Rate Limiting Compliance: Enforce 2.0 QPS request pacing to respect Human Protein Atlas API infrastructure.
- Process Data Before Rendering UI: Always run the data retrieval and enrichment pipeline (
scripts/run_pipeline.pyor modular scripts) on the user's requested gene/protein first so thatdashboard.htmldisplays the actual processed data. - Mandatory Dashboard Artifact Emission: When generating or updating the interactive HTML dashboard, you MUST emit the standalone HTML file as a user-facing artifact named
dashboard.htmlusingwrite_to_filewithArtifactMetadata: { UserFacing: true, Summary: "Interactive Evaluation Dashboard", RequestFeedback: false }(in addition to keepingdashboard.htmlupdated in the project root/output directory). This ensures the dashboard immediately opens and renders directly in the agent harness preview pane without requiring the user to manually copy or open links in an external browser. - Icon-Only Light/Dark Theme Toggle: Maintain the icon-only Light/Dark theme switcher button in the dashboard header containing only the SVG Sun and Moon vector icons.
- Attribution: State in output that Human Protein Atlas Database Visualize was used, citing Uhlén et al. (Science 2015) and Thul et al. (Science 2017).
Workflows
1. Unified End-to-End Pipeline (Recommended)
Run full protein profiling, subcellular mapping, and dashboard compilation:
python3 scripts/run_pipeline.py --gene TP53 -o ./output/TP53/
Profile by Ensembl ID with tissue filtering:
python3 scripts/run_pipeline.py --ensembl_id ENSG00000141736 --tissues "cerebral cortex,liver,heart muscle" -o ./output/ERBB2_tissues/
Deterministic offline mock mode (for sandboxed testing without network):
python3 scripts/run_pipeline.py --gene TP53 -o ./output/mock_tp53/ --mock
After run_pipeline.py completes and outputs dashboard.html:
- Copy or write the generated
dashboard.htmlto the project root (./dashboard.html) for local testing. - Emit
dashboard.htmlto the agent harness artifact directory usingwrite_to_filewithArtifactMetadata: { UserFacing: true, Summary: "Interactive Evaluation Dashboard", RequestFeedback: false }.
2. Modular Subcommands
Query raw endpoints directly using scripts/hpa_cli.py:
# Resolve gene symbol to Ensembl ID
python3 scripts/hpa_cli.py resolve-ensembl-id TP53 --output ./output/tp53_id.json

# Fetch tissue protein expression (IHC)
python3 scripts/hpa_cli.py get-tissue-expression ENSG00000141510 --output ./output/tp53_tissue.json

# Fetch subcellular location
python3 scripts/hpa_cli.py get-subcellular-location ENSG00000141510 --output ./output/tp53_subcellular.json

# Fetch full atlas entry
python3 scripts/hpa_cli.py get-atlas-entry ENSG00000141510 --output ./output/tp53_entry.json

# Search HPA by criteria
python3 scripts/hpa_cli.py search-hpa --query "tissue_category_rna:Brain;Tissue enriched" --output ./output/brain_enriched.json
3. Specialized Visualization & Analytical Modules
Invoke individual enrichment and visualization scripts directly when custom intermediate artifacts are needed:
# Enrich subcellular locations with GO terms and generate interactive SVG cell schematic
python3 scripts/visualize_subcellular.py \
    --input_json ./output/mock_tp53/subcellular_raw.json \
    --output_json ./output/mock_tp53/subcellular_enriched.json \
    --output_html ./output/mock_tp53/subcellular_map.html

# Group 44+ normal tissues into 10 anatomical systems and compute IHC staining scores (0.0-3.0)
python3 scripts/visualize_tissue_ihc.py \
    --input_json ./output/mock_tp53/tissue_ihc.json \
    --output_json ./output/mock_tp53/tissue_ihc_enriched.json \
    --output_html ./output/mock_tp53/tissue_ihc_atlas.html

# Evaluate 2x2 RNA consensus (nTPM) vs. IHC protein concordance
python3 scripts/visualize_concordance.py \
    --atlas_entry_json ./output/mock_tp53/atlas_entry.json \
    --tissue_ihc_json ./output/mock_tp53/tissue_ihc.json \
    --output_json ./output/mock_tp53/concordance_summary.json \
    --output_html ./output/mock_tp53/concordance_matrix.html

# Compile standalone HTML5 interactive dashboard
python3 scripts/generate_dashboard.py \
    --gene_symbol TP53 \
    --atlas_entry ./output/mock_tp53/atlas_entry.json \
    --subcellular_json ./output/mock_tp53/subcellular_enriched.json \
    --tissue_json ./output/mock_tp53/tissue_ihc_enriched.json \
    --concordance_json ./output/mock_tp53/concordance_summary.json \
    --output ./output/mock_tp53/dashboard.html