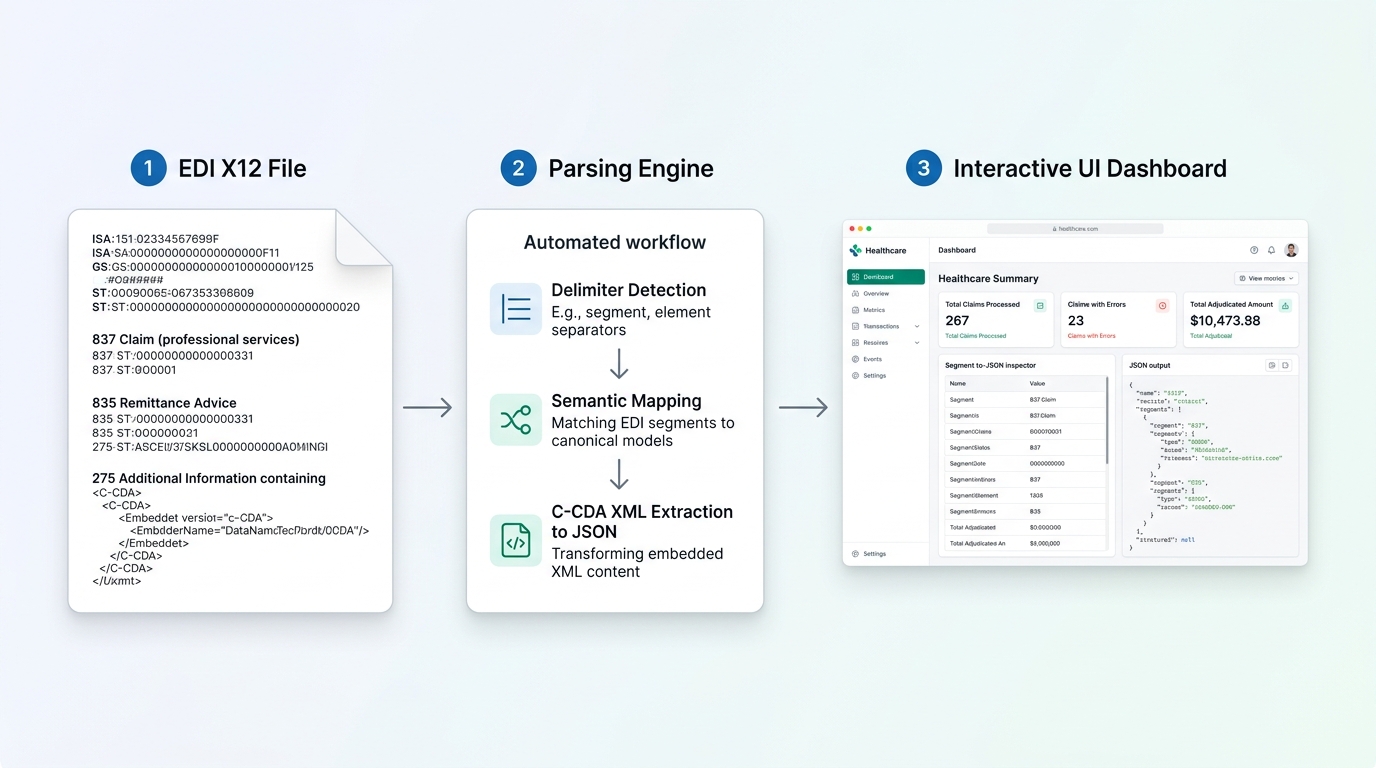
EDI X12 & C-CDA Healthcare Parser Skill
This skill enables autonomous agents and users to parse raw EDI X12 healthcare transactions (837, 835, 270, 271, 277, 275, 278) and embedded C-CDA XML clinical documents into structured JSON, as well as render interactive, business-ready visual dashboards.
1. Visual Dashboard Capabilities
Enterprise AI environments render custom visual UI widgets using a sandboxed <iframe> container.
How Dashboard Rendering Works
- Sandboxed HTML/JS/CSS Execution: Renders self-contained single-page dashboards with full DOM interactivity and zero external node dependencies.
- Tailwind CSS Styling:
<script src="https://cdn.tailwindcss.com"></script>
- Workspace Theme Adaptation: Uses CSS variables (
--app-background, --app-foreground, --app-card, --app-border, --app-primary, --app-muted, etc.) to match host workspace color palettes.
- Light & Dark Theme Toggle: Adapts seamlessly to system preferences via
html.light / html.dark classes with a built-in user theme switch button.
For architecture and sandbox details, see the Visual Dashboard Guide.
2. Interactive Visual Dashboard Features
The visual dashboard provides:
- Interactive X12 & JSON Synchronized Inspector:
- Clickable Segment Stream: Click any segment (
ISA, GS, ST, CLM, NM1, SV1, CLP, CAS, STC, BDS, etc.) to inspect its details.
- Healthcare Business Meaning Card: Displays segment tag, official name, healthcare workflow purpose, EDI 5010 loop name, target JSON key path, and element-by-element value breakdown table.
- JSON Equivalent Subtree: Displays the exact JSON node corresponding to the clicked segment with one-click copy.
- Transaction Details & Metrics:
- KPI metrics bar (Transaction Type, Billed/Paid Amount, Claims, Service Lines, Flagged Attachments, Clinical records).
- Envelope grids (ISA, GS, ST, SE, GE, IEA).
- Business Entities cards (Submitter, Receiver, Billing Provider, Subscriber, Patient, Payers).
- Transaction-specific tables for 837 Claims, 835 Remittance, 277 Attachment requests, 270/271 Eligibility, and 278 Prior Authorization.
- C-CDA Clinical Payload Viewer (for 275 transactions):
- Formatted clinical document viewer displaying Patient Demographics, Allergies, Active Medications, Problem List / Diagnoses, Vital Signs, and Clinical Notes.
- Raw X12 File Viewer:
- Line numbering, syntax highlighting, search/filter, copy EDI text, and download
.x12 file.
- Structured JSON Viewer:
- Complete hierarchical JSON output with syntax highlighting, search/filter, copy JSON, and download
.json file.
- Field Mapping Specification:
- Complete searchable dictionary of standard X12 segments to JSON mappings.
- Live In-Dashboard Parser & Sample Switcher:
- Drag-and-drop or paste any custom X12 transaction directly in the UI to re-parse and re-render on the fly.
3. Workflow: Parsing & Generating Visual Dashboards
When the user provides an X12 file or asks to parse/inspect EDI transactions:
Step 1: Execute Parser & Dashboard Generator
Run the executable generator helper script:
python3 skills/x12-healthcare-parser/scripts/generate_visual_dashboard.py <path_to_file.x12> -o docs/x12_dashboard.html
Or from Python:
from x12_parser import X12Parser

# Parse to structured JSON
parsed_data = X12Parser.parse(raw_x12_content)

# Generate interactive visual dashboard
X12Parser.generate_dashboard(
    parsed_data,
    output_path="docs/x12_dashboard.html",
    raw_x12=raw_x12_content,
    title="Dashboard - Healthcare Transaction"
)
Step 2: Present Results to User
- Summarize the transaction type, key metrics (billed charges, paid amounts, claims count, clinical findings).
- Provide a relative path link to open the visual dashboard:
[Open Interactive Visual Dashboard](docs/x12_dashboard.html)
4. Helper Scripts & References
- Executable Helper Script: generate_visual_dashboard.py
- Visual Dashboard Guide: visual_dashboard_guide.md
- EDI to JSON Mapping Specifications: x12_json_mapping_specs.md
- Python Usage Example: parse_and_visualize_example.py
1---2name: x12-healthcare-parser3description: Production-ready EDI X12 (5010) and C-CDA XML healthcare transaction parser with interactive visual mapping dashboards, field-by-field semantic dictionaries, and live translation inspectors.4metadata:5 source: https://skillmd.com/skills/terravic/x12-healthcare-parser6---78# EDI X12 & C-CDA Healthcare Parser Skill910This skill enables autonomous agents and users to parse raw EDI X12 healthcare transactions (`837`, `835`, `270`, `271`, `277`, `275`, `278`) and embedded C-CDA XML clinical documents into structured JSON, as well as render interactive, business-ready visual dashboards.1112---1314## 1. Visual Dashboard Capabilities1516Enterprise AI environments render custom visual UI widgets using a sandboxed `<iframe>` container.1718### How Dashboard Rendering Works191. **Sandboxed HTML/JS/CSS Execution**: Renders self-contained single-page dashboards with full DOM interactivity and zero external node dependencies.202. **Tailwind CSS Styling**:21 ```html22 <script src="https://cdn.tailwindcss.com"></script>23 ```243. **Workspace Theme Adaptation**: Uses CSS variables (`--app-background`, `--app-foreground`, `--app-card`, `--app-border`, `--app-primary`, `--app-muted`, etc.) to match host workspace color palettes.254. **Light & Dark Theme Toggle**: Adapts seamlessly to system preferences via `html.light` / `html.dark` classes with a built-in user theme switch button.2627For architecture and sandbox details, see the [Visual Dashboard Guide](skills/x12-healthcare-parser/references/visual_dashboard_guide.md).2829---3031## 2. Interactive Visual Dashboard Features3233The visual dashboard provides:34351. **Interactive X12 & JSON Synchronized Inspector**:36 - **Clickable Segment Stream**: Click any segment (`ISA`, `GS`, `ST`, `CLM`, `NM1`, `SV1`, `CLP`, `CAS`, `STC`, `BDS`, etc.) to inspect its details.37 - **Healthcare Business Meaning Card**: Displays segment tag, official name, healthcare workflow purpose, EDI 5010 loop name, target JSON key path, and element-by-element value breakdown table.38 - **JSON Equivalent Subtree**: Displays the exact JSON node corresponding to the clicked segment with one-click copy.392. **Transaction Details & Metrics**:40 - KPI metrics bar (Transaction Type, Billed/Paid Amount, Claims, Service Lines, Flagged Attachments, Clinical records).41 - Envelope grids (ISA, GS, ST, SE, GE, IEA).42 - Business Entities cards (Submitter, Receiver, Billing Provider, Subscriber, Patient, Payers).43 - Transaction-specific tables for 837 Claims, 835 Remittance, 277 Attachment requests, 270/271 Eligibility, and 278 Prior Authorization.443. **C-CDA Clinical Payload Viewer (for 275 transactions)**:45 - Formatted clinical document viewer displaying Patient Demographics, Allergies, Active Medications, Problem List / Diagnoses, Vital Signs, and Clinical Notes.464. **Raw X12 File Viewer**:47 - Line numbering, syntax highlighting, search/filter, copy EDI text, and download `.x12` file.485. **Structured JSON Viewer**:49 - Complete hierarchical JSON output with syntax highlighting, search/filter, copy JSON, and download `.json` file.506. **Field Mapping Specification**:51 - Complete searchable dictionary of standard X12 segments to JSON mappings.527. **Live In-Dashboard Parser & Sample Switcher**:53 - Drag-and-drop or paste any custom X12 transaction directly in the UI to re-parse and re-render on the fly.5455---5657## 3. Workflow: Parsing & Generating Visual Dashboards5859When the user provides an X12 file or asks to parse/inspect EDI transactions:6061### Step 1: Execute Parser & Dashboard Generator62Run the executable generator helper script:63```bash64python3 skills/x12-healthcare-parser/scripts/generate_visual_dashboard.py <path_to_file.x12> -o docs/x12_dashboard.html65```6667Or from Python:68```python69from x12_parser import X12Parser7071# Parse to structured JSON72parsed_data = X12Parser.parse(raw_x12_content)7374# Generate interactive visual dashboard75X12Parser.generate_dashboard(76 parsed_data,77 output_path="docs/x12_dashboard.html",78 raw_x12=raw_x12_content,79 title="Dashboard - Healthcare Transaction"80)81```8283### Step 2: Present Results to User841. Summarize the transaction type, key metrics (billed charges, paid amounts, claims count, clinical findings).852. Provide a relative path link to open the visual dashboard:86 ```markdown87 [Open Interactive Visual Dashboard](docs/x12_dashboard.html)88 ```8990---9192## 4. Helper Scripts & References9394- **Executable Helper Script**: [generate_visual_dashboard.py](skills/x12-healthcare-parser/scripts/generate_visual_dashboard.py)95- **Visual Dashboard Guide**: [visual_dashboard_guide.md](skills/x12-healthcare-parser/references/visual_dashboard_guide.md)96- **EDI to JSON Mapping Specifications**: [x12_json_mapping_specs.md](skills/x12-healthcare-parser/references/x12_json_mapping_specs.md)97- **Python Usage Example**: [parse_and_visualize_example.py](skills/x12-healthcare-parser/examples/parse_and_visualize_example.py)